Insights into OceanBase Database 4.0: Issues Addressed by End-to-end Tracing, Starting with a Slow SQL Query
About the author: Xiao Yi, Senior Technical Expert at OceanBase, has supported Ant Group's Double 11 Shopping Festival multiple times. He is a key member of the TPC-C and TPC-H performance team and specializes in designing and developing SQL engine components, including link protocols, execution plans, and execution engines.
In the previous article, we discussed what DDL challenges a database faces when it transitions from a standalone architecture to a distributed one and what solutions and design ideas OceanBase Database V4.0 has taken to ensure more efficient and transparent DDL operations for better user experience in O&M. In this article, we delve into fault tracing and diagnosis, another important capability in database O&M.
First, let's read this conversation:
A business manager complained: "The database requests are going to take a million years to finish. Could you have a look?"

Rolling down the real-time monitoring records of the database node, the database administrator (DBA) felt strange: "I don't see any slow SQL statements here."


The business manager asked: "What's going on then?"

DBA: "Maybe there is something wrong with the connection between the client and the database node. Let me check the logs of the proxy server."

One hour later... "The time consumption shown in the logs of the proxy looks good." the DBA frowned. "Maybe it's the network problem between the client and the proxy?"
Well, this is a short story about troubleshooting a slow SQL statement in a distributed database. This issue, if not solved soon, will greatly affect the user experience, or even lead to service unavailability. That's why we made it a priority to offer simple, efficient diagnostics. Compared with standalone databases, a distributed database typically has a cluster of dozens or hundreds of servers, with multiple interlinked components working together to process user requests. It is more challenging to achieve fast and efficient fault diagnosis and location.
OceanBase Database V4.0 has significantly improved its diagnostic capabilities by supporting visual end-to-end tracing of SQL requests. This feature helps users quickly locate the specific execution stage, machine, and module of a fault, with the detailed execution information provided. It makes O&M simple and efficient. In this article, we will share our thoughts on efficient database diagnosis and introduce to you the benefits and design ideas of the end-to-end tracing feature in OceanBase Database from the following perspectives:
- Purpose of end-to-end tracing
- Benefits of end-to-end tracing
- Design of end-to-end tracing
- Performance of end-to-end tracing in OceanBase Database V4.0
Purpose of End-to-end Tracing
In OceanBase Database, a user request is first sent to OBProxy, a SQL request proxy service, which routes the request to one of the OBServer nodes of the OceanBase cluster. Then, the request is processed by many modules in different engines, such as the SQL engine, storage engine, and transaction engine, depending on the request type. The request may also access data on multiple OBServer nodes by remote procedure call (RPC) tasks. At last, the result is returned to the client.
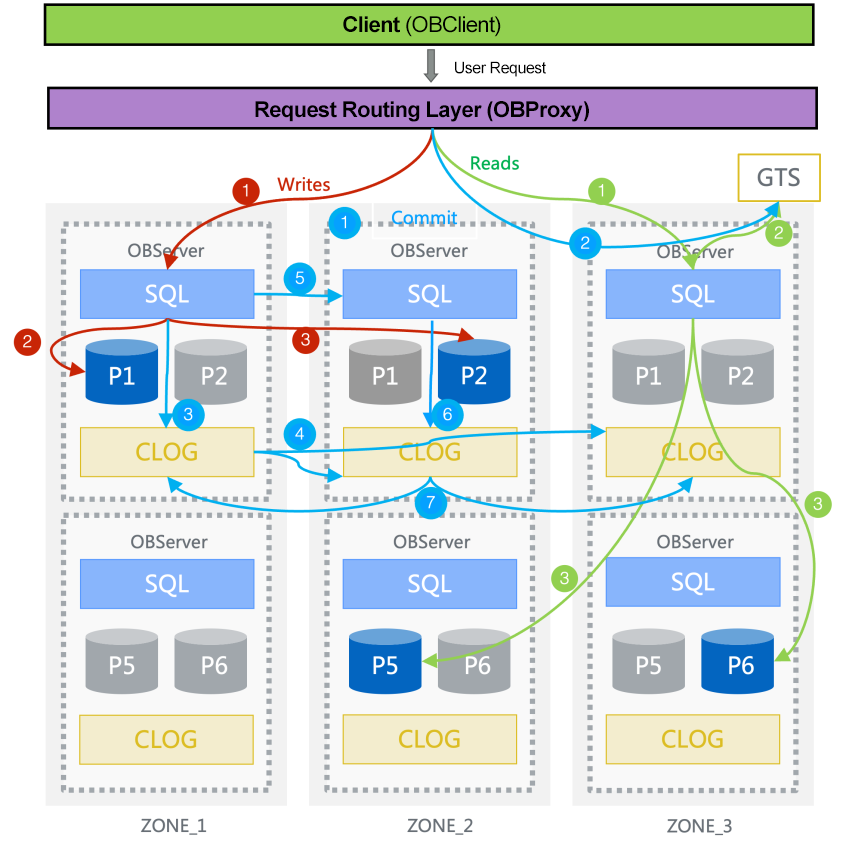
Figure 1 SQL request execution processes in OceanBase Database
If a user request returns an error or is executed slowly, it may be caused by the execution fault of a component or the connection problems between components. OceanBase Database of earlier versions has provided users with a range of monitoring and diagnostic capabilities, such as SysStat, SQL Audit, Trans Stat, Tenant Dump, Slow Trans, and Slow Query, and OceanBase Cloud Platform (OCP), the database management platform of OceanBase, has supported visual diagnostic operations such as transaction, TopSQL, and SlowSQL diagnostics based on the output of those monitoring capabilities. However, these capabilities cannot provide enough information for the O&M team to quickly check for issues and efficiently restore the faulty service from an end-to-end perspective. It often takes a long time, sometimes with the help of component experts, to merely locate the execution stage, machine, or module where the issue occurs.
To further improve the diagnostic efficiency of user request exceptions in a distributed system, OceanBase Database V4.0 supports end-to-end tracing. This feature traces the information of user SQL requests executed by different components at different stages of the entire data processing link, and presents the information to users in a visual way, allowing users to quickly hunt down the target.
Benefits of End-to-end Tracing
End-to-end tracing of transactions and SQL statements
OceanBase Database V4.0 supports user-facing fine-grained end-to-end tracing of transactions and SQL statements. For a business department, the total time consumed by a business service is often of greater concern. In an online transaction processing (OLTP) system, for example, a business service usually consists of one or more transactions. Therefore, it is more practical to take a transaction as the elementary tracing unit. The end-to-end tracing feature creates a trace for each transaction, and records the execution information of each SQL statement in the OBClient > OBProxy > OBServer link in the transaction. By combing through a trace, users are able to quickly find the SQL statements executed in the transaction and get the execution information at OBClient.
In a real business system that utilizes end-to-end tracing, once users find a slow SQL request or transaction, they can quickly locate the very execution stage that drags down the progress of the whole execution link. Or, if users notice that it takes a long time to initiate an SQL request since the end of the last one in a transaction, they can consult with the business department to figure out the possible problems in the business logic.
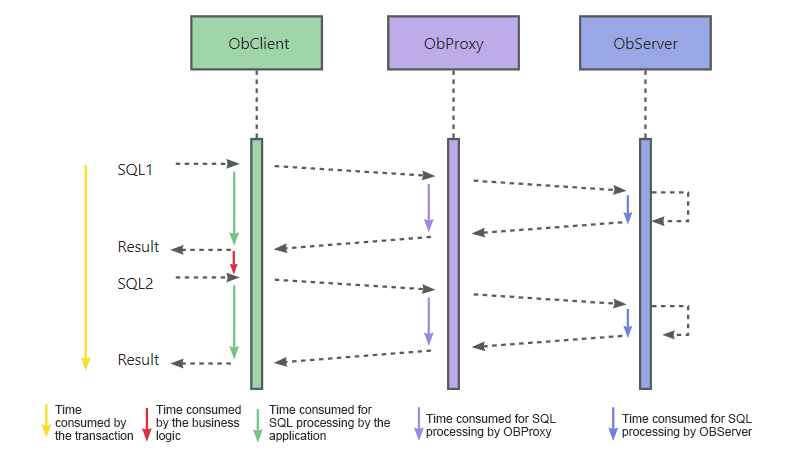
Figure 2 SQL requests in a transaction
End-to-end tracing in a distributed system
OceanBase Database V4.0 supports end-to-end tracing in a distributed system. In the distributed architecture of OceanBase Database, OBProxy may route a received user request to any one of the OBServer nodes in the cluster, and the requested data may be distributed across multiple OBServer nodes. Moreover, the execution engine will assign SQL execution tasks to different OBServer nodes. If a cluster has many OBServer nodes, questions arise. Which OBServer nodes handle these SQL requests and tasks? How much time does each module on an OBServer node take? These are common concerns for O&M personnel.
The end-to-end tracing feature allows users to trace the entire execution link of SQL requests in a distributed scenario that involves multiple OBServer nodes. Users can find details such as the OBServer nodes that received requests, the OBServer nodes that executed remote tasks, and the scheduling status and execution time of each task.
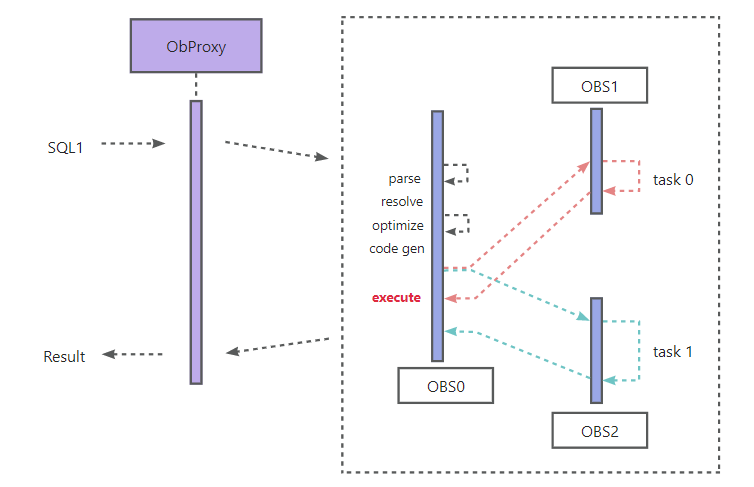
Figure 3 Execution process of a distributed request
Convenient association between diagnostics and the business system
Many users have built their own monitoring and diagnostic systems. When a request gets slow or an error is reported in the database, users may need to quickly associate the event with the corresponding SQL diagnostics in the system to get troubleshooting done faster. End-to-end tracing allows users to easily associate diagnostics with the business system. They can set an app trace ID for a request from the business system to the database by using the Java Database Connectivity (JDBC) or SQL API. The app trace ID is recorded in the end-to-end tracing information.
When an error is reported for a request or database call, users can use the corresponding app trace ID to quickly search for the associated database trace in the end-to-end diagnostic system, and then view the time consumption of the request or database call at each execution stage of the database link and the point where the error is reported, so as to identify the component that triggers the error in a short period of time.
Multiple end-to-end information display modes
OCP allows users to quickly find faulty requests by using different metrics, such as the time consumption, trace ID, and SQL statement ID. Also, OCP clearly displays the execution information of the entire execution link from the client to each component of the database, which helps users locate the problematic stage in no time.
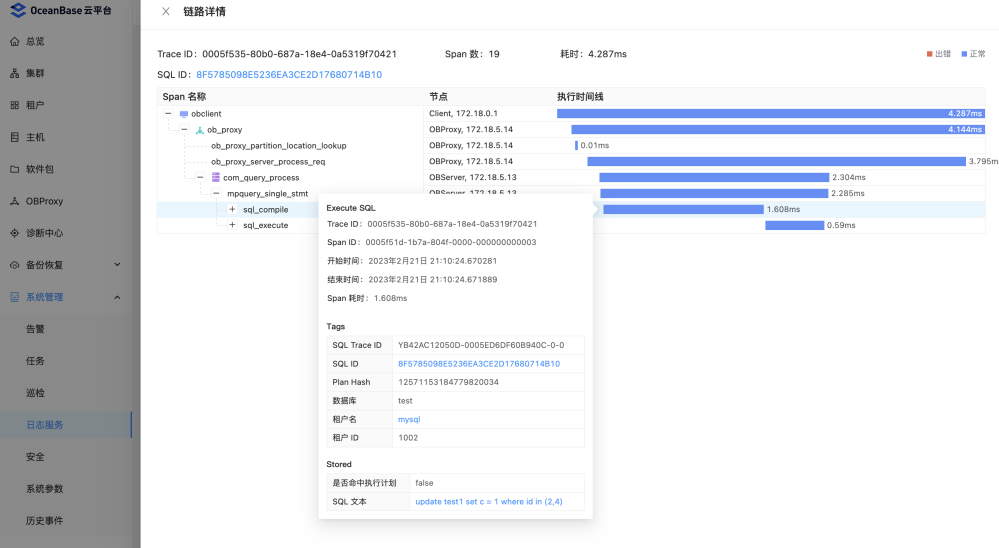
Figure 4 A link details page on OCP
OceanBase Database V4.0 also supports interactive end-to-end tracing operations. For example, if users manually execute an SQL statement in the command line, and want to inspect the execution link of the statement to get the time consumption of each stage for performance analysis or optimization, they can use the Show Trace feature to easily spot the performance bottlenecks. The following sample code shows the execution process of two distributed parallel tasks (px_task) by running the Show Trace command. Users can specify keywords and options in the command to see more details.
    OceanBase(admin@test)>select/*+parallel(2)*/ count(*) from t1;
    +----------+
    | count(*) |
    +----------+
    |        5 |
    +----------+
    1 row in set (0.005 sec)

    OceanBase(admin@test)>show trace;
    +-------------------------------------------+----------------------------+------------+
    | Operation                                 | StartTime                  | ElapseTime |
    +-------------------------------------------+----------------------------+------------+
    | obclient                                  | 2023-03-01 17:51:30.143537 | 4.667 ms   |
    | └─ ob_proxy                               | 2023-03-01 17:51:30.143716 | 4.301 ms   |
    |    └─ com_query_process                   | 2023-03-01 17:51:30.145119 | 2.527 ms   |
    |       └─ mpquery_single_stmt              | 2023-03-01 17:51:30.145123 | 2.513 ms   |
    |          ├─ sql_compile                   | 2023-03-01 17:51:30.145133 | 0.107 ms   |
    |          │  └─ pc_get_plan                | 2023-03-01 17:51:30.145135 | 0.061 ms   |
    |          └─ sql_execute                   | 2023-03-01 17:51:30.145252 | 2.350 ms   |
    |             ├─ open                       | 2023-03-01 17:51:30.145252 | 0.073 ms   |
    |             ├─ response_result            | 2023-03-01 17:51:30.145339 | 2.186 ms   |
    |             │  ├─ px_schedule             | 2023-03-01 17:51:30.145342 | 1.245 ms   |
    |             │  │  ├─ px_task              | 2023-03-01 17:51:30.146391 | 1.113 ms   |
    |             │  │  │  ├─ get_das_id        | 2023-03-01 17:51:30.146979 | 0.001 ms   |
    |             │  │  │  ├─ do_local_das_task | 2023-03-01 17:51:30.147012 | 0.050 ms   |
    |             │  │  │  └─ close_das_task    | 2023-03-01 17:51:30.147237 | 0.014 ms   |
    |             │  │  └─ px_task              | 2023-03-01 17:51:30.146399 | 0.868 ms   |
    |             │  │     ├─ get_das_id        | 2023-03-01 17:51:30.147002 | 0.001 ms   |
    |             │  │     ├─ do_local_das_task | 2023-03-01 17:51:30.147036 | 0.041 ms   |
    |             │  │     └─ close_das_task    | 2023-03-01 17:51:30.147183 | 0.011 ms   |
    |             │  └─ px_schedule             | 2023-03-01 17:51:30.147437 | 0.001 ms   |
    |             └─ close                      | 2023-03-01 17:51:30.147536 | 0.049 ms   |
    |                └─ end_transaction         | 2023-03-01 17:51:30.147571 | 0.002 ms   |
    +-------------------------------------------+----------------------------+------------+
Integration with other diagnostic features
Now we know that users can quickly locate the faulty component or module with the help of the end-to-end tracing feature. What if users want to dig deeper and get more execution details? No worries. The end-to-end tracing feature is integrated with other diagnostic features designed for different modules, which helps users get diagnostic insights.
For example, if users, with the help of the end-to-end tracing feature, confirm that the SQL execution engine is the culprit of a slow SQL request, they can launch the SQL Plan Monitor feature based on the sql_trace_id parameter of the SQL request to check out the execution information of operators and threads of the associated execution plan. As shown in Figure 5, we can see the details of each operator, such as the CPU time (the green bar in the DBTime column), the waiting time (the red bar in the DBTime column), and the number of rows returned.

Figure 5 Execution information displayed by SQL Plan Monitor
Design of End-to-end Tracing
The figure below shows the key OceanBase components that make the end-to-end tracing feature possible. In this section, we will describe in detail the OpenTracing data model, which we use to record the trace information, generation of trace data, and integrated data analysis and display on OCP.
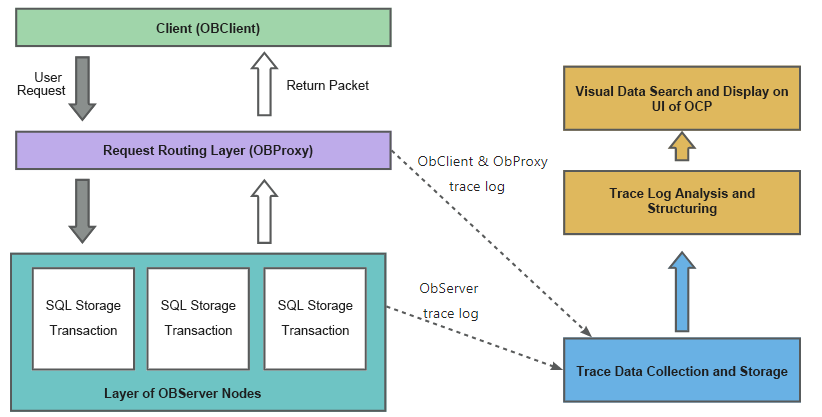
Figure 6 OceanBase components that enable the end-to-end tracing feature
Data model
The end-to-end tracing feature of OceanBase Database uses the OpenTracing model to record data. This model is widely used in a large number of distributed tracing systems. In the figure below, the left part shows the OpenTracing model, and the right part shows the corresponding end-to-end tracing data model of OceanBase Database. Each trace corresponds to one database transaction and multiple spans. An SQL request corresponds to a span, which records the information about an execution process. In addition, each span records a log that is persisted to the trace file.
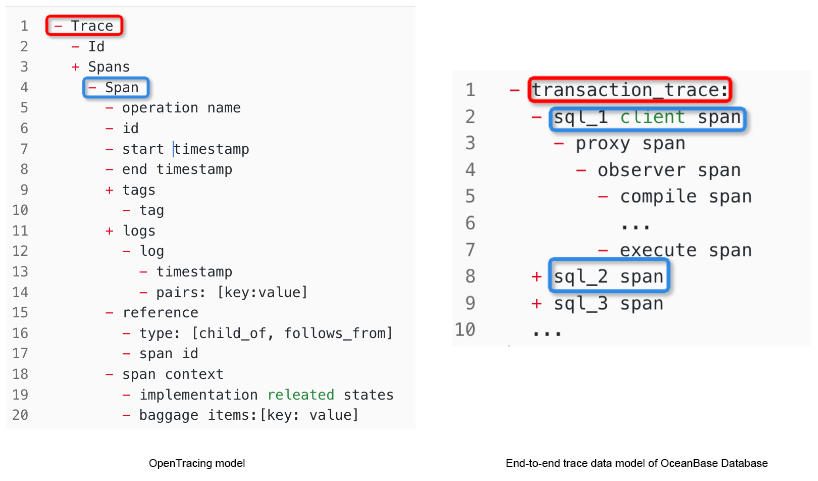
Figure 7 End-to-end tracing data models
Generation of trace data
One of the key capabilities of the end-to-end tracing feature is to generate complete and valid trace data. On the one hand, we have studied each component in the entire request execution link, making careful decisions on the stages and information to be recorded in specific spans, to ensure that the end-to-end tracing data is accurate and useful. On the other hand, we have also taken account of the performance impact of trace data generation, which is caused mainly by the overhead for recording the trace data into the memory, and that for writing the trace data to the trace file. To minimize the impact on performance and provide users with more useful information for end-to-end diagnostics, OceanBase Database supports various control strategies. Users can set different sampling frequencies for traces to record complete trace information. OceanBase Database also writes the full trace information of slow and faulty SQL statements that users are more concerned about into the trace file.

Figure 8 Generation of trace logs for each component
The trace files are independently stored on the machines that host the obproxy and observer processes. Considering that a database client interacts with the business server, the end-to-end tracing information of OBClient is not recorded on the business server, but transferred to OBProxy.
Integrated data analysis and display on OCP
OCP allows users to search for the trace information of a request by specified conditions and view the details of the execution link in a GUI. The trace information comes from the trace logs of the obproxy and observer processes on different servers. OCP provides special backend collectors to collect and parse the trace logs, and then store them in Elasticsearch. The collected data is the raw span data, and the data of the same trace may be scattered in different spans on different servers. It is hard to search data by span tags. Therefore, the OCP server regularly merges key span data of a trace, such as the time consumption at each stage and important tags, into one data record to construct a profile of the trace. This way, users can efficiently query the trace information by different combined conditions and the results can be neatly presented on pages.
Performance of End-to-end Tracing in OceanBase Database V4.0
You must remember the slow SQL story at the beginning of this article. So, what changes can the end-to-end tracing feature bring to the O&M work?
By using the feature, if users notice that business requests are slow, they can simply navigate to the end-to-end trace search page on OCP, sort SQL requests by time consumption, find the most time-consuming requests in a certain time period, and check for requests with unexpectedly long execution time. If a time-consuming SQL request is confirmed with the help of TopSQL diagnostics, or the app trace ID of the related user is obtained, the trace ID can be used as a filter to narrow down the scope of search.

Figure 9 Request searching on the end-to-end trace search page on OCP
Once the time-consuming SQL request is identified, we can diagnose what went wrong exactly. At this point, users can click the trace ID on the OCP page to expand the trace information of the request, as shown in Figure 10. The measured execution time is 4.47 ms at OBClient, 4.366 ms at OBProxy, and 3.246 ms at the OBServer node. Based on the normal time consumption of each end, we can come to the conclusion that the OBServer node took the most time in the execution. Going deeper, we can see that a large part of the time was consumed at the SQL compile stage, at which the SQL execution plan was generated. We can now come to a preliminary conclusion that the execution of this SQL request was slow because it failed to hit the execution plan.
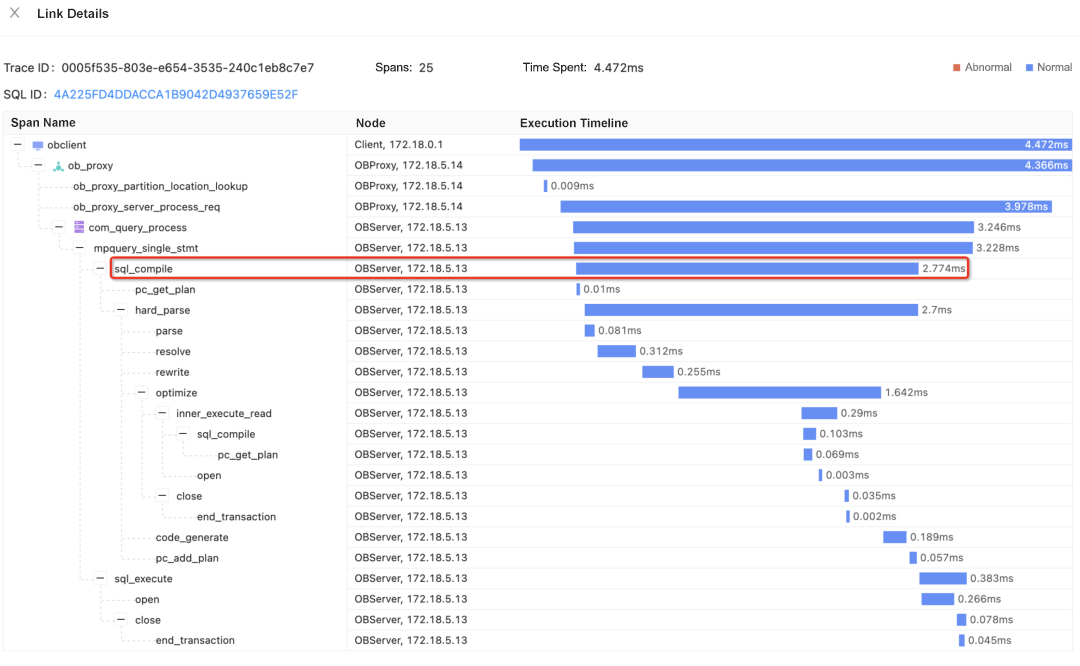
Figure 10 End-to-end tracing details presented on OCP
On the end-to-end tracing details page on OCP, we can see the path by which the SQL request calls each module, and the time consumption of each stage. For example, users can tell simply by checking the timeline that the transport of the request from OBClient to OBProxy did not take too much time. However, if users want to know the time consumed from OBClient initiating the request to OBProxy receiving the request, they can click the span of OBClient and that of OBProxy respectively. As shown in Figure 11, we can quickly figure out that the difference between the start times of the two stages is 187 μs. In other words, users are able to analyze an issue in a more detailed way.

Figure 11 Details of end-to-end tracing stages
Afterword
The end-to-end tracing feature of OceanBase Database V4.0 achieves the observability of each transaction and SQL request, allowing users to efficiently diagnose and locate a fault. We believe this new feature will further speed up the troubleshooting process and make database O&M easier and more efficient. As an important part of enhancing the usability of OceanBase Database, we will also focus on providing a better O&M experience by integrating more features into OceanBase Database V4.x, such as Active Session History (ASH), Realtime SQL Plan Monitor, and Logical Plan Manager. Feel free to leave your comments below and share your ideas on database diagnostics.