Slow Response
Business and Database Symptoms
Business symptom: Business responses slow down or even time out.
Database symptom: SQL execution time increases, and the response time (RT) for SQL requests becomes longer.
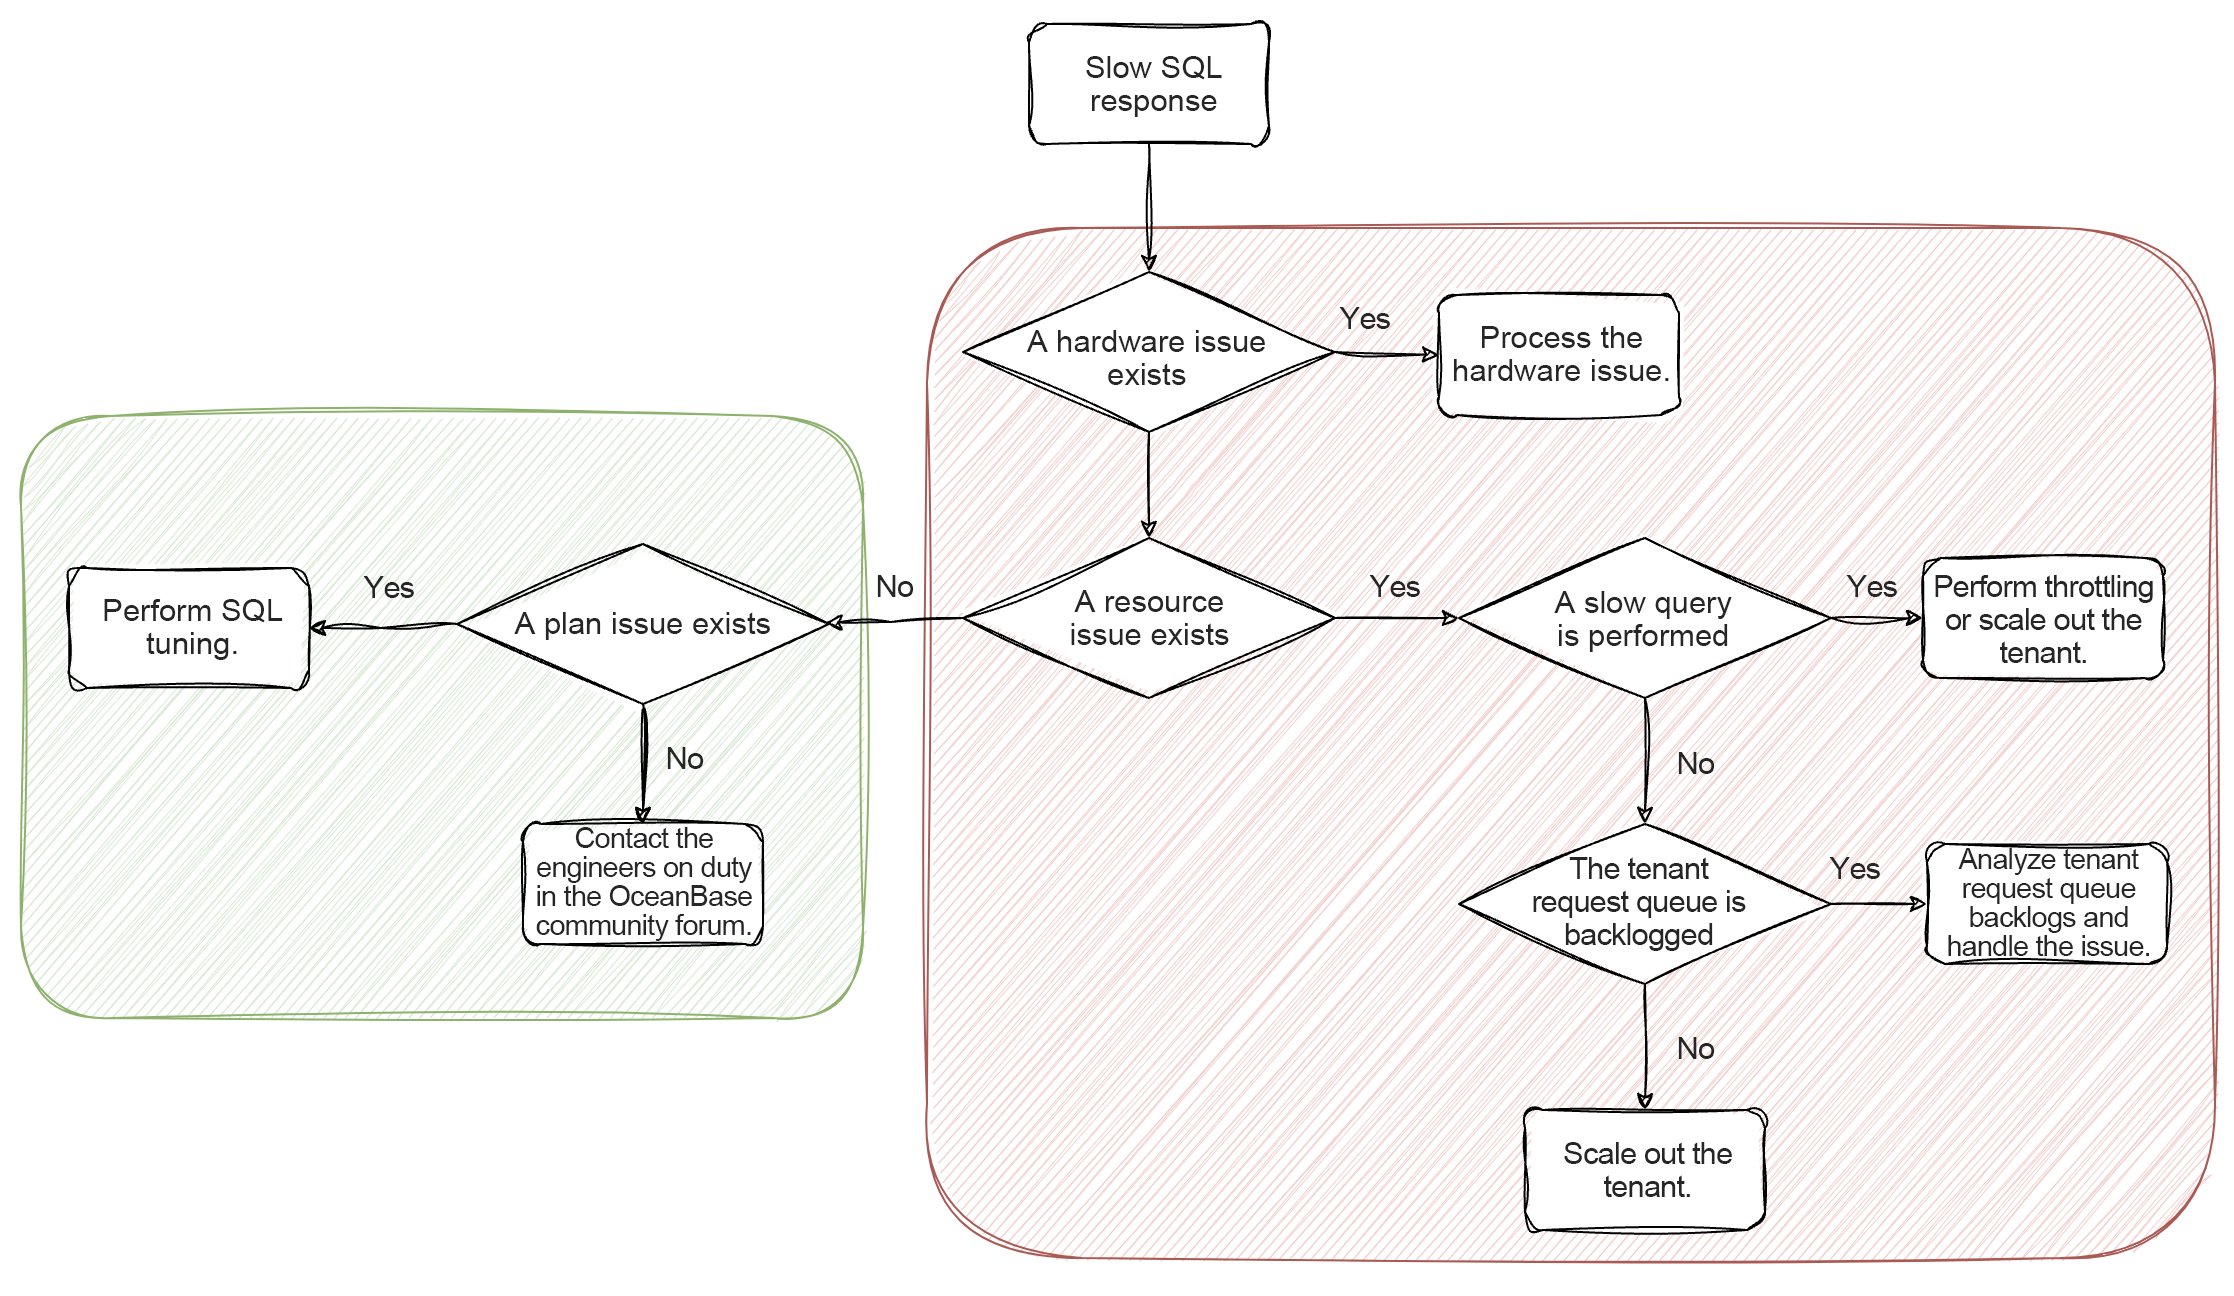
Troubleshooting Approach and Procedure
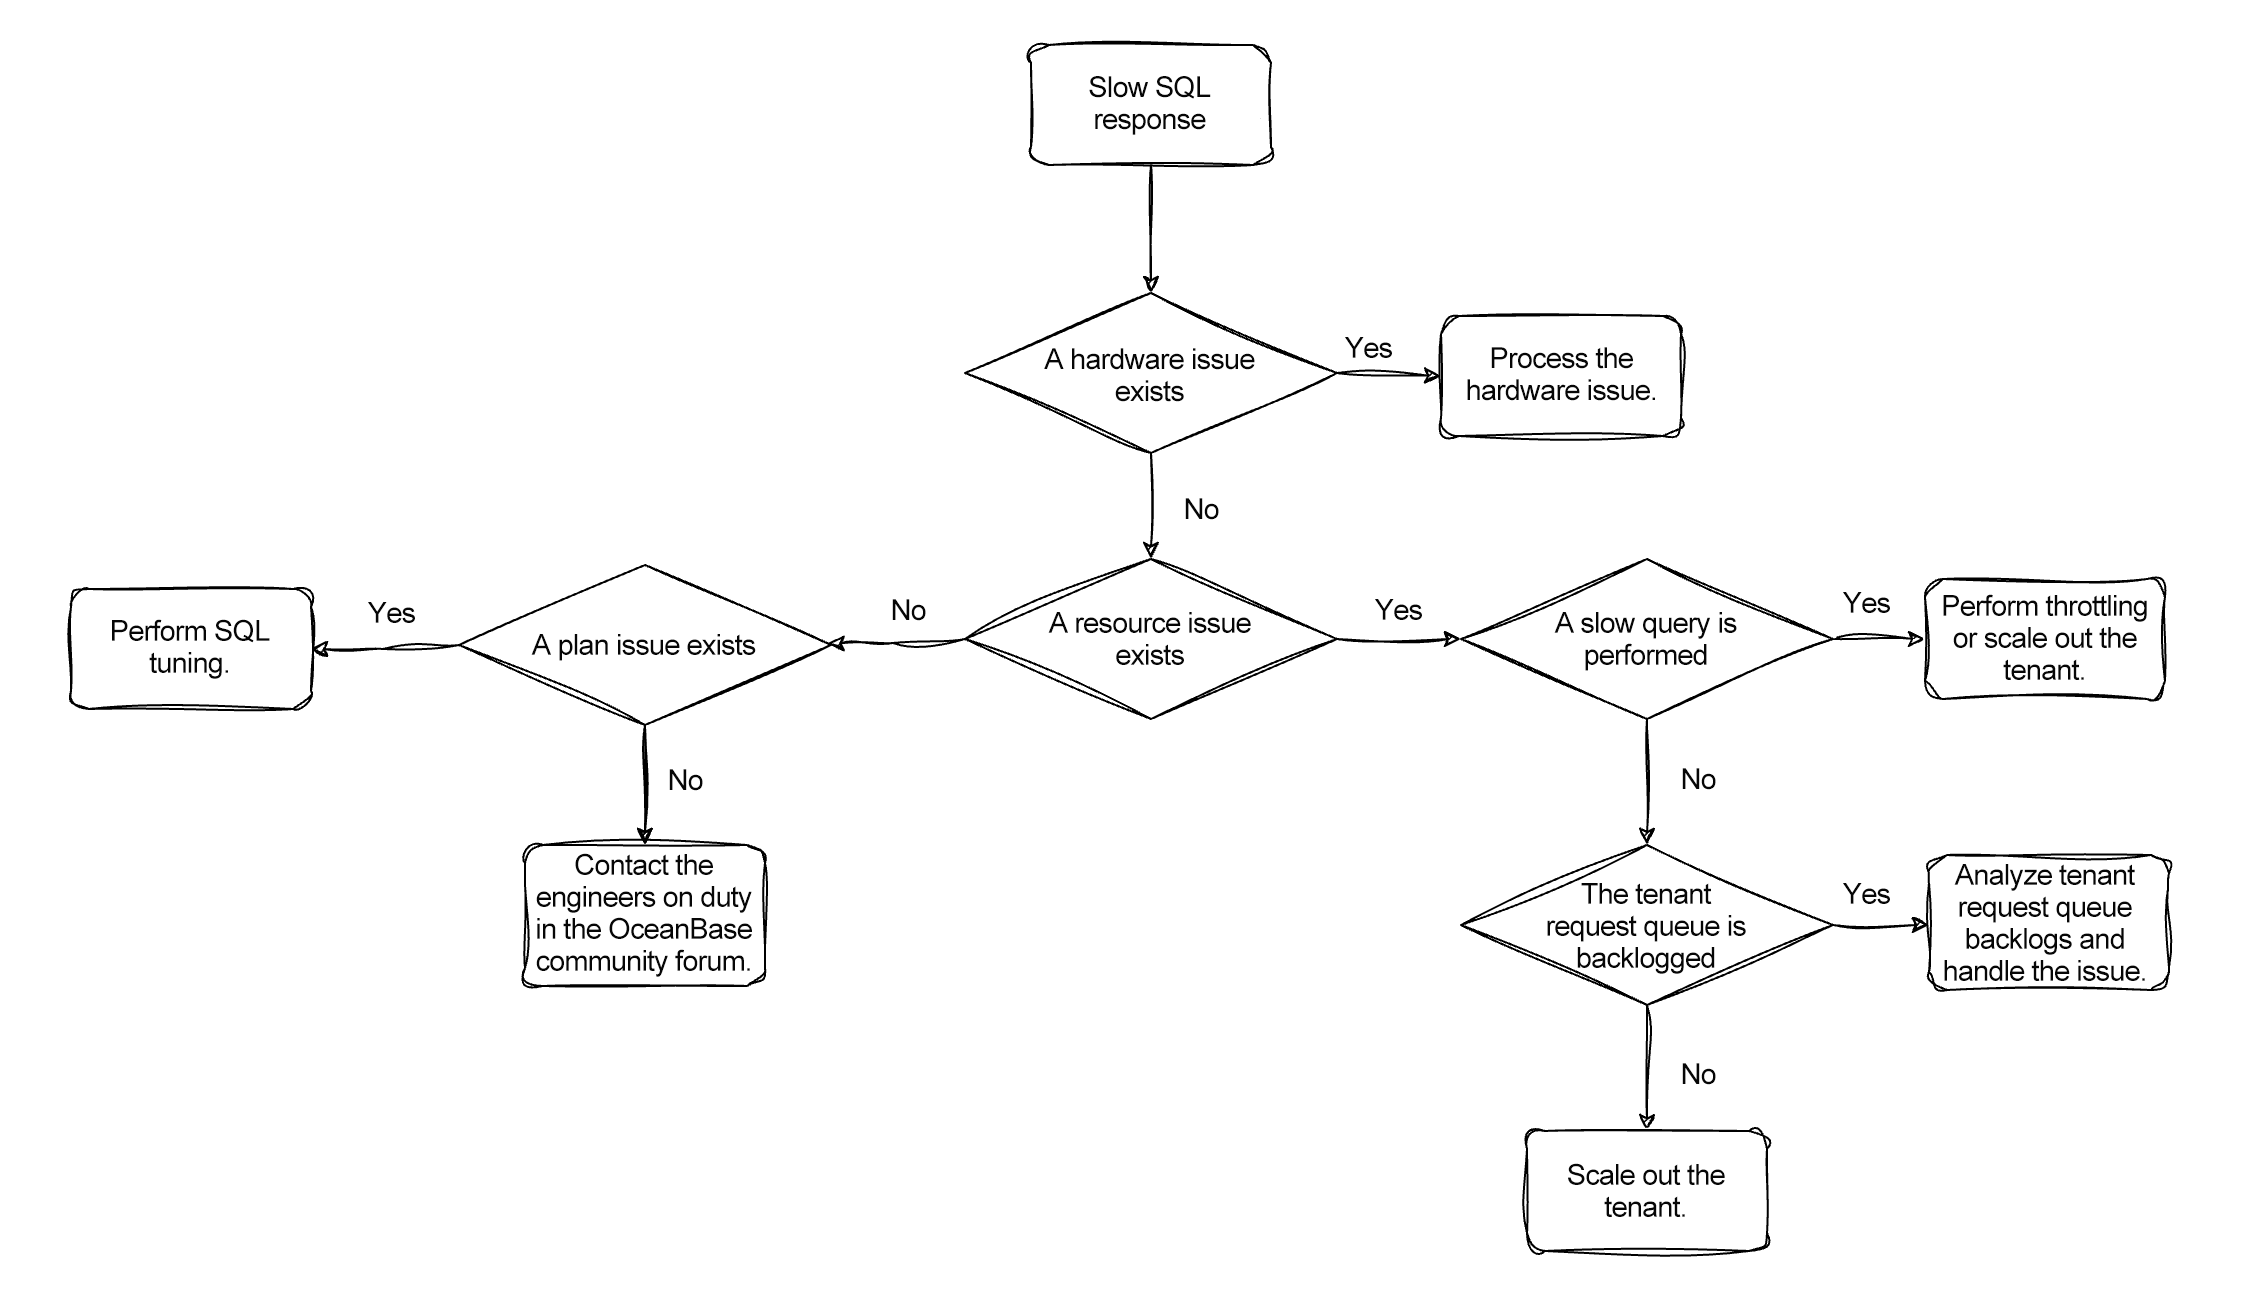
Troubleshoot hardware issues
Check whether slow SQL responses are caused by hardware issues such as issues related to networks and disk I/O.
Troubleshoot slow queries
Check whether suspicious SQL queries exist in OceanBase Cloud Platform (OCP).
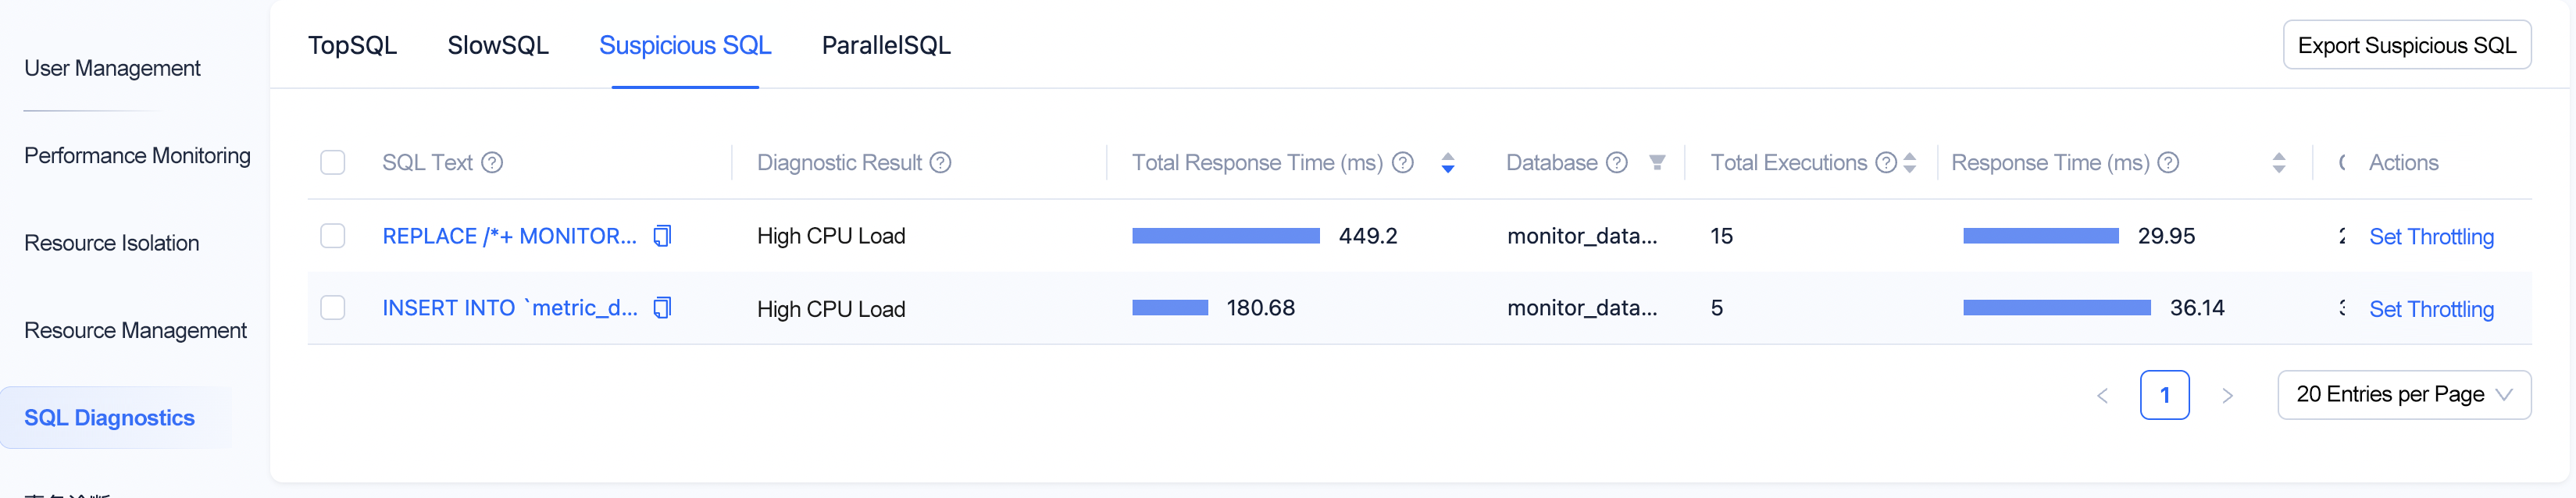
If the system responds to short requests with high latency because most resources are occupied by slow queries, you can troubleshoot as follows:
-
Enable throttling for slow queries that occupy excessive resources in OCP.
-
Set the large_query_worker_percentage parameter to specify the percentage of worker threads reserved for slow queries. The default value of the parameter is 30%.
-
Set the large_query_threshold parameter to specify the threshold for determining a slow query. The default value of the parameter is 5 seconds. Modifying this parameter will significantly affect the system. We recommend that you do not modify the parameter unless you understand it.
-
Add hosts in OCP and scale up the OceanBase Database tenant after more nodes are added to zones. For more information, see Scale out an OceanBase cluster and scale up an OceanBase Database tenant.
Troubleshoot tenant request queue backlogs
Troubleshooting methods
In addition to slow queries that occupy excessive resources, you need to troubleshoot tenant request queue backlogs by using the following methods:
-
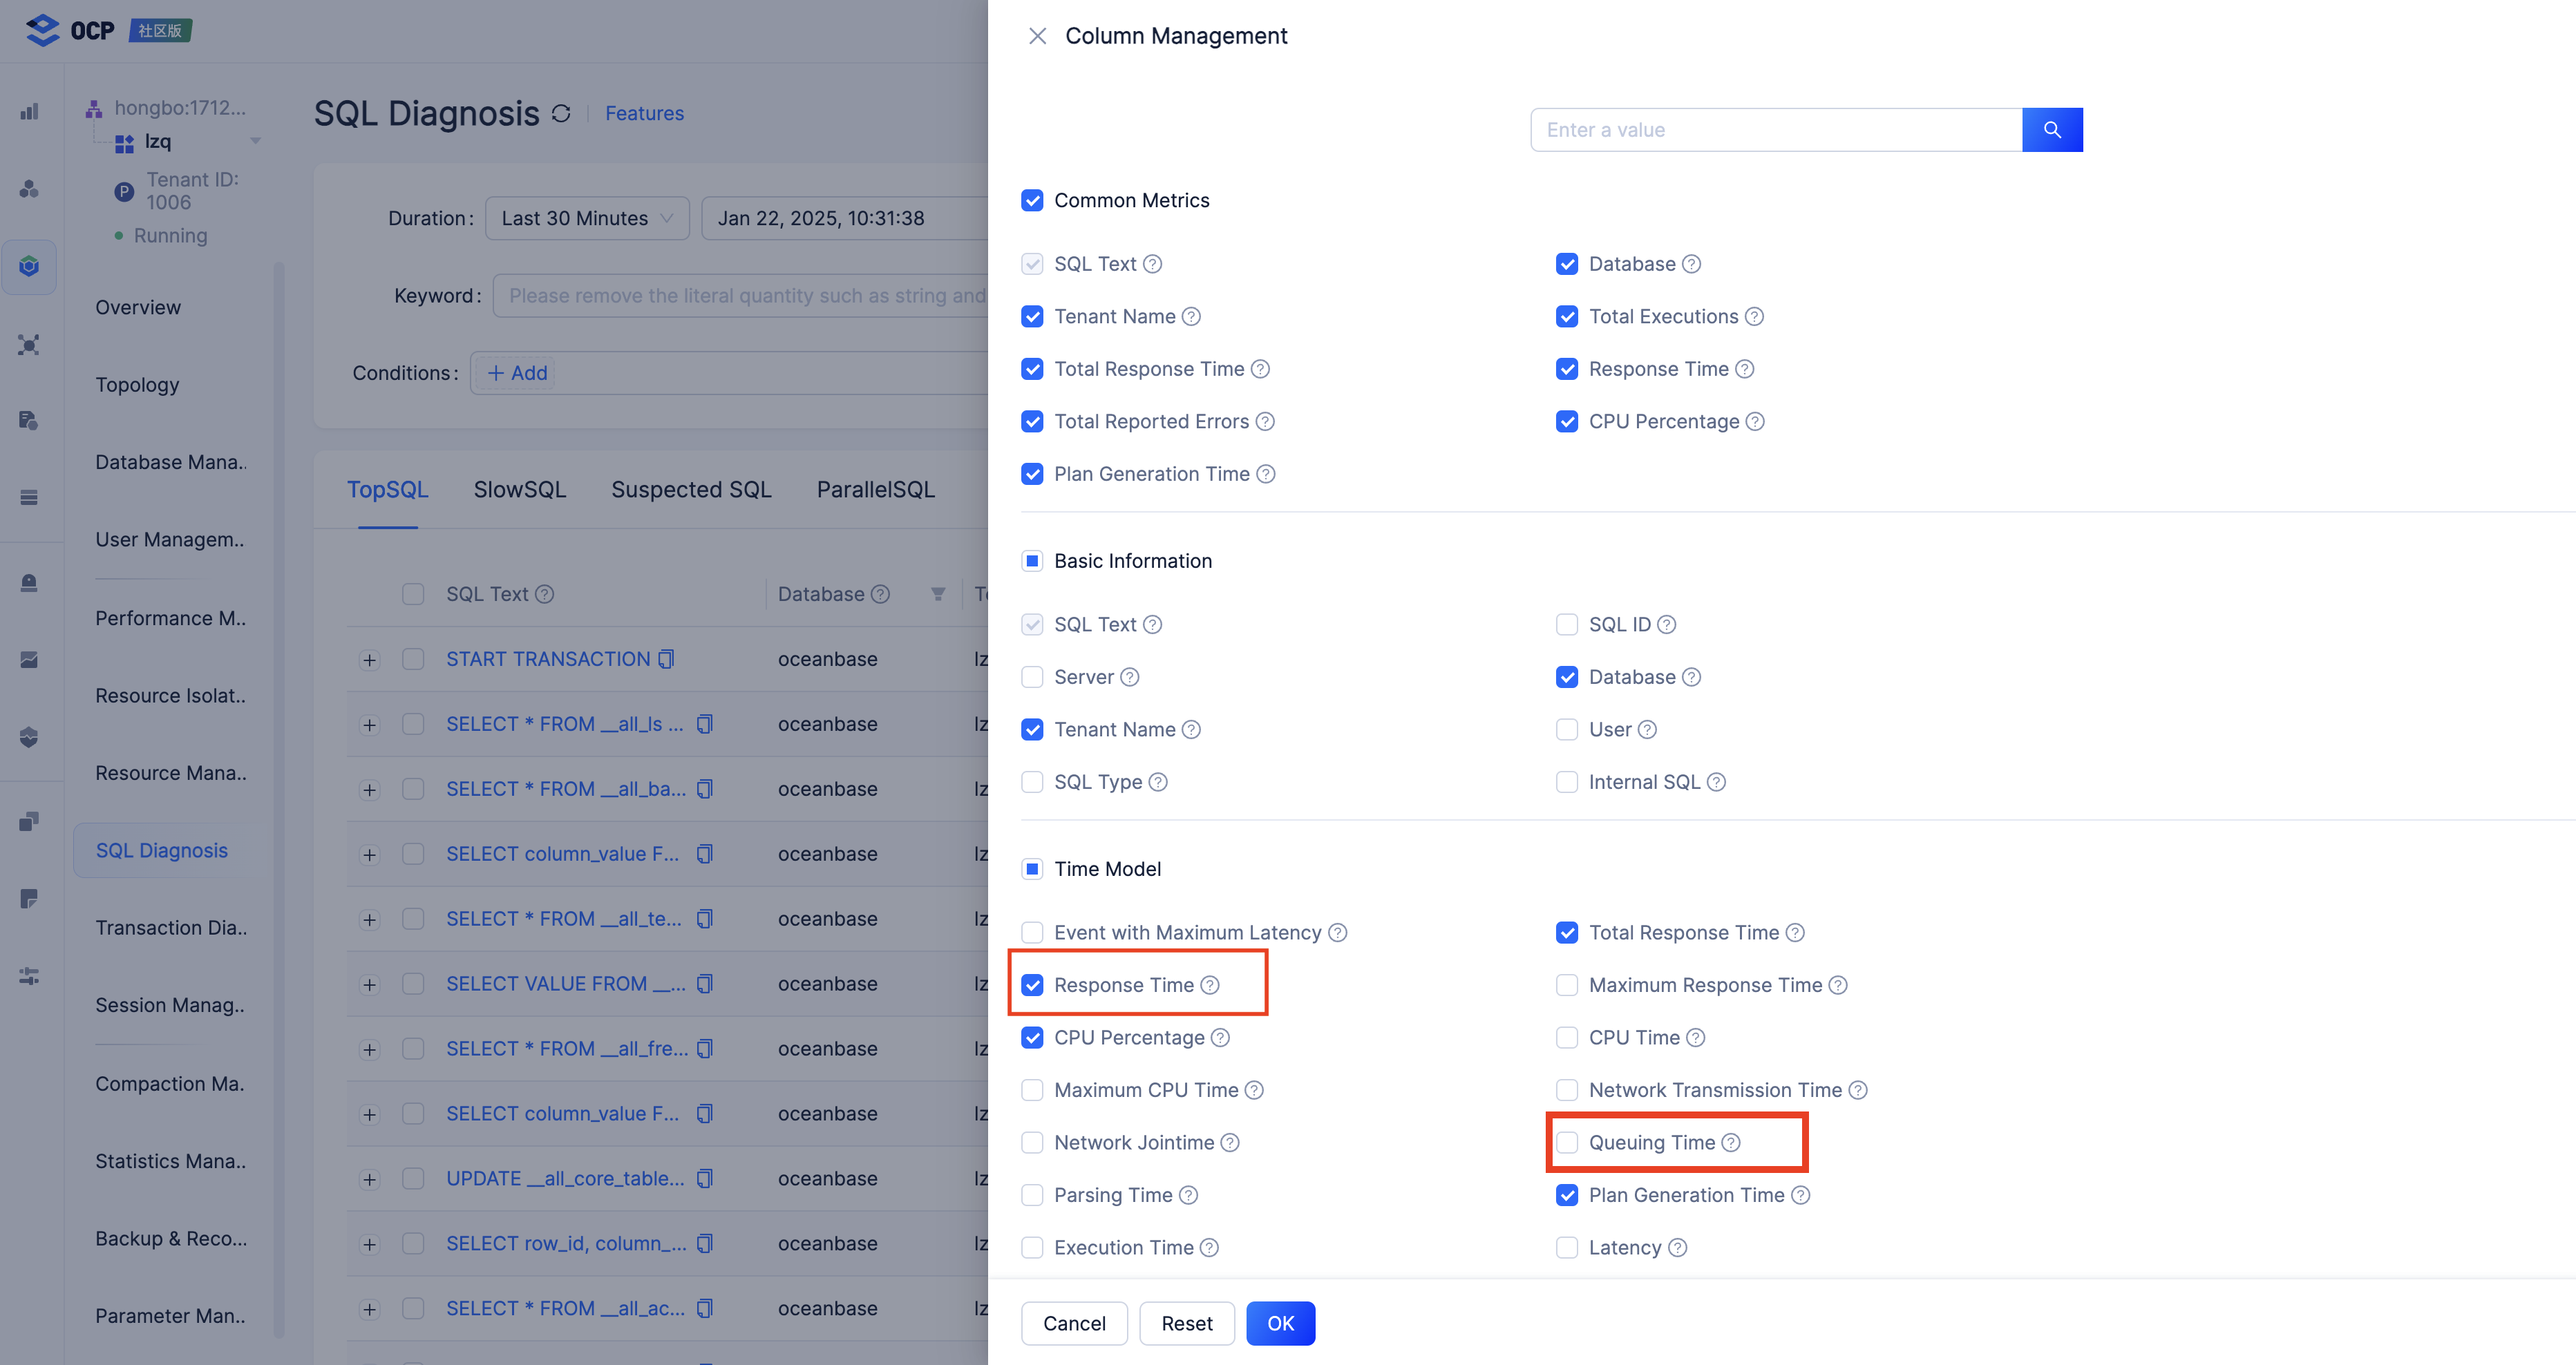
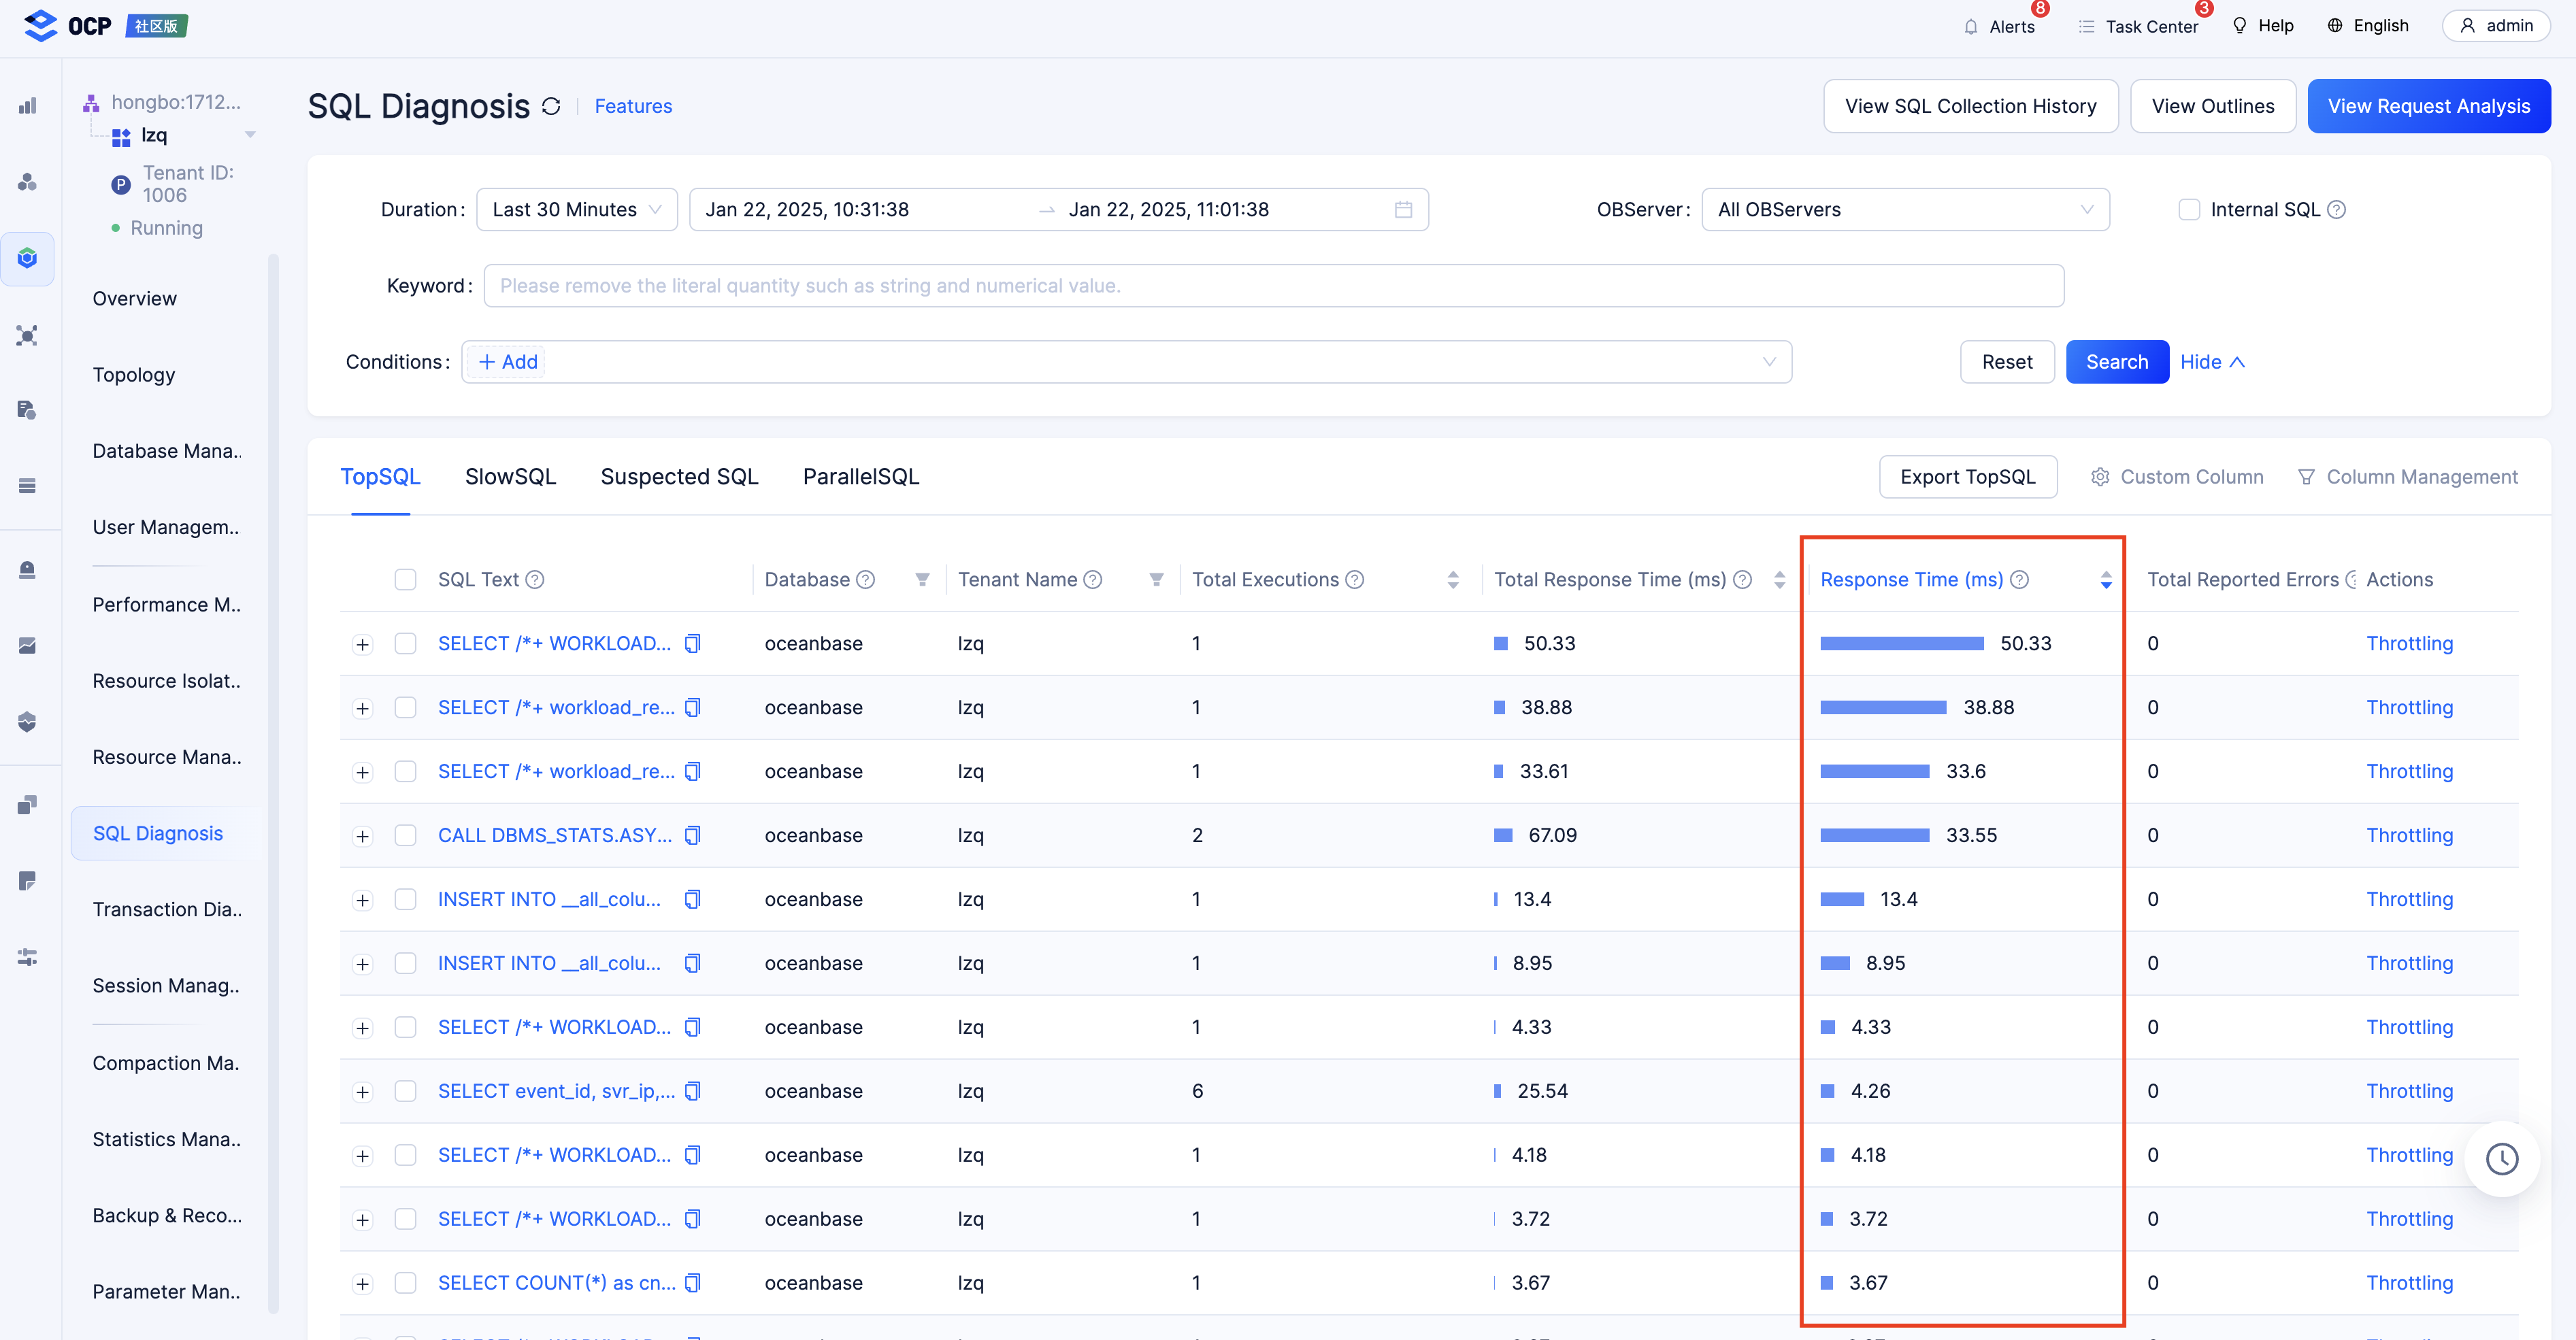
Check if the average queuing time of a slow query as a percentage of the response time is as expected. If the average queuing time is too long, the tenant request queue may be backlogged.
-
Query the information about a slow query in the
GV$OB_SQL_AUDITview. For more information, see Perform analysis based on SQL monitoring views. The following figure shows the intervals between important events.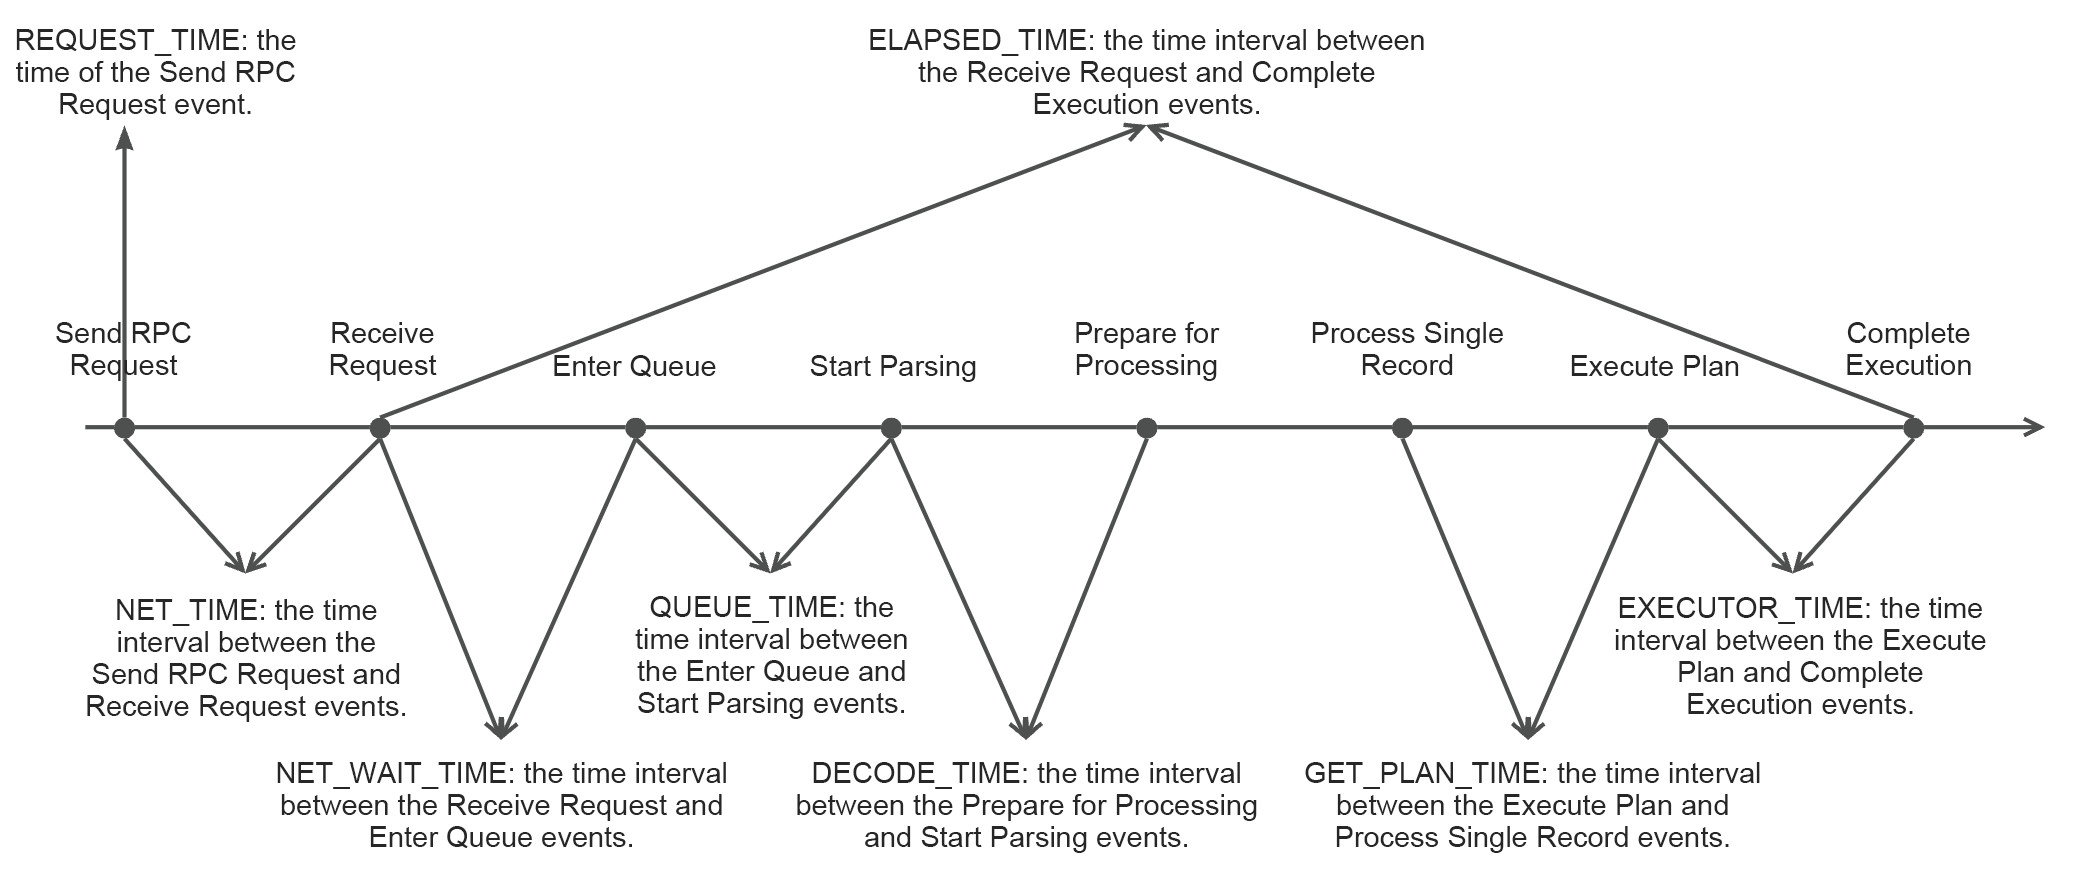
-- In this example, an SQL request that is executed by the tenant with ID 1002 after 2024-11-20 12:00:00,
-- with an execution time exceeding 100 ms, is queried.

select
    tenant_id,
    request_id,
    usec_to_time(request_time),
    elapsed_time,
    queue_time,
    execute_time,
    query_sql
from
    oceanbase.GV$OB_SQL_AUDIT
where
    tenant_id = 1002
    and elapsed_time > 100000
    and request_time > time_to_usec('2024-11-20 12:00:00')
    order by
    elapsed_time desc
limit 1 \G

*************************** 1. row ***************************
                tenant_id: 1002
                request_id: 13329994
usec_to_time(request_time): 2024-11-20 15:14:58.765564
            elapsed_time: 153118
                queue_time: 34
            execute_time: 139873
                query_sql: select * from xxxx where xxxx;
1 row in set (0.11 sec) -
To observe the request queue backlogs of a specific tenant, you can search the logs by using the "dump tenant info" keyword, which is the most common method.
grep 'dump tenant info' observer.log*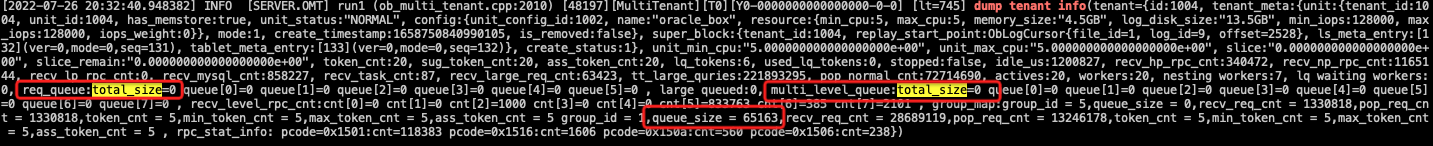
You can refer to the following keywords in the logs:
-
req_queue: the regular request queue.
-
total_size=n: n indicates the total number of requests in the queue.
-
queue[x]=y: y indicates the number of requests at a specific priority in the queue. A smaller value of x indicates a higher priority.
-
-
multi_level_queue: the nested request queue.
-
total_size=n: n indicates the total number of requests in the queue.
-
queue[x]=y: y indicates the number of requests at a specific nesting level in the queue. x indicates the nesting level.
-
queue[0]: non-nested requests. This parameter is left empty in most cases because non-nested requests are queued in the regular request queue.
-
queue[1]: requests at nesting level 1, such as a remote procedure call (RPC) request triggered by an SQL query.
-
queue[2]: requests at nesting level 2, such as an RPC request triggered by another RPC request that was initiated by an SQL query.
-
…
-
-
-
group_id = x, queue_size = y: y indicates the number of requests in a grouped request queue.
- A group is used to process RPC requests of a specific type. Each group ID corresponds to a request type. For more information, see ob_group_list.h.
This method allows you to view historical information about both tenant request queues and threads. However, the logs are printed periodically, which means the information is less timely.
- Log in to the sys tenant and execute the following SQL statement to observe request queue backlogs of a tenant:
obclient [oceanbase]> select * from oceanbase.__all_virtual_dump_tenant_info where tenant_id = 1002\G
*************************** 1. row ***************************
            svr_ip: 11.158.31.20
            svr_port: 22602
        tenant_id: 1002
        compat_mode: 0
        unit_min_cpu: 2
        unit_max_cpu: 2
            slice: 0
        remain_slice: 0
        token_cnt: 10
    ass_token_cnt: 10
        lq_tokens: 0
    used_lq_tokens: 0
            stopped: 0
            idle_us: 0
    recv_hp_rpc_cnt: 99
    recv_np_rpc_cnt: 2226
    recv_lp_rpc_cnt: 0
    recv_mysql_cnt: 5459
    recv_task_cnt: 5
recv_large_req_cnt: 0
recv_large_queries: 3661
            actives: 10
            workers: 10
lq_waiting_workers: 0
req_queue_total_size: 0
            queue_0: 0
            queue_1: 0
            queue_2: 0
            queue_3: 0
            queue_4: 0
            queue_5: 0
        large_queued: 0
1 row in set (0.001 sec)
You can view the real-time queue information in the virtual table. However, the virtual table does not record the historical queue information.
Solutions
The thread model of OceanBase Database is a typical producer-consumer model. If the request production speed is faster than the request consumption speed for a long period of time, requests are accumulated in queues and the maximum queue size is reached. In this case, error code -4019 is returned.
Even if the maximum queue size is not reached, requests may still wait in the queue for a long period of time in scenarios such as when a large number of auto-increment columns exist. For more information about auto-increment columns, see the "Sequences" section in Extended features of a MySQL tenant of OceanBase Database.
To solve this issue, perform the following operations:
-
If the maximum request queue size is reached, you can recover the service only through restart. Rejecting new requests will not help. We recommend that you submit your question in the OceanBase community forum and contact engineers on duty to obtain technical support. The engineers will help you obtain stack traces by using obstack or pstack to identify the cause.
-
In most cases, the maximum request queue size will not be reached. Request queue backlogs are the more common issue.
-
If the request queue is backlogged, check whether auto-increment columns with the ORDER property exist.
-
If the issue is not caused by bulk data writes to auto-increment columns, contact engineers on duty in the OceanBase community forum to obtain technical support. The engineers will help you analyze stack traces by using obstack or pstack.
-
If the request queue backlog is not caused by deadlocks, you can upgrade tenant specifications to address the issue in special scenarios. The "special scenarios" here refer to situations involving high overhead from threads waiting for locks due to bulk data writes or those involving operations that are extremely CPU-intensive. You can use the top or tsar tool to identify such operations.
-
Troubleshoot plan issues
If slow responses are not caused by resource issues, they may be due to plans.
If SQL execution is "slowing down", you can troubleshoot the following common issues:
-
Bad case of the plan cache (cardinality). For more information about the issue description, troubleshooting method, and solution, see Bad case of the plan cache. This issue may occur in the following scenarios:
- If SQL statements are identical except for the constants they contain, the database reuses the same plan from the plan cache for them. This scenario has been introduced in the getting-started tutorial.
To avoid this scenario, later versions of OceanBase Database will cache different plans for SQL statements with the same structure but different constants in certain scenarios.
- Statistics on the table accessed by an SQL query have significantly changed, but the database still uses the previously cached plan from the plan cache.
This scenario will also be eliminated in later versions.
- If SQL statements are identical except for the constants they contain, the database reuses the same plan from the plan cache for them. This scenario has been introduced in the getting-started tutorial.
-
Buffer tables. For more information, see Buffer table issues. No details will be provided here.
The getting-started tutorial provides an approach to solving this issue, which is to improve the major compaction frequency of specific tables. In addition to the manual compaction feature, OceanBase Database V4.2.0 and later support the adaptive major compaction feature. You can set the
table_modeparameter toqueueto resolve the issue. For more information, see Adaptive major compactions. -
Change of optimal plans to non-optimal plans after version upgrade.
-
In most cases, plans become more optimal after version upgrade. This issue occurs rarely, and is not described in the getting-started tutorial. You can view the historical trends and plan changes of an SQL statement in OCP to check for the issue.
-
For more information about the solution, see the "Use hints to generate a plan" and "Use an outline to bind a plan" sections in Read and manage SQL execution plans in OceanBase Database.
-
-
Hard parsing. You can view the historical trends in the generation time of an SQL execution plan in OCP to check for the issue. For more information about the solution, see the "Hard parsing" section in Typical scenarios and troubleshooting logic for SQL performance issues.
If SQL execution does not change from fast to slow but "remains consistently slow", refer to SQL performance diagnostics and tuning.