High CPU Load
Business and Database Symptoms
Business symptom: Business delays occasionally occur, and the operation call failure rate increases.
Database symptom: The database receives alerts for high CPU utilization, the response time of SQL queries increases, and the monitored CPU utilization spikes.
Troubleshooting Approach and Procedure
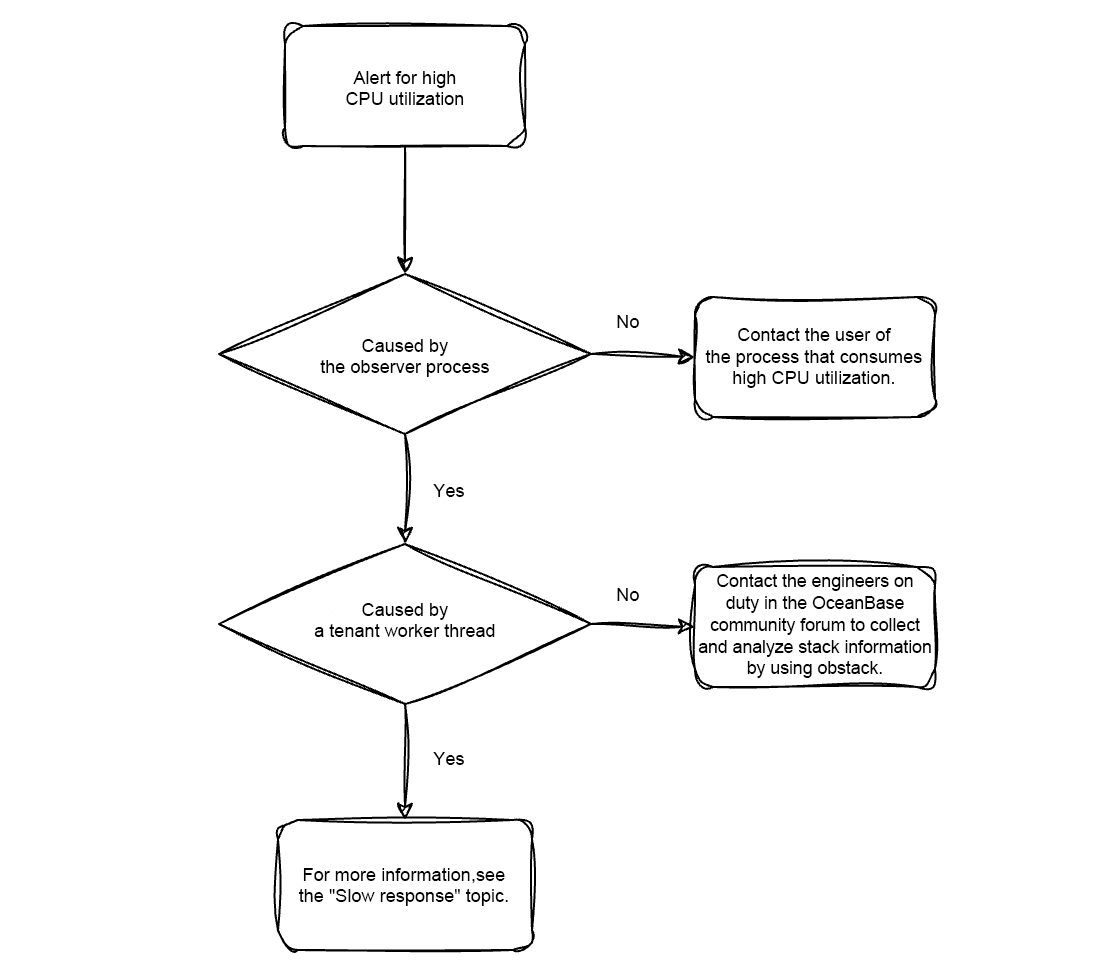
Troubleshoot processes with high CPU utilization on an OBServer node
Run the ps or top command to check whether only the observer process on an OBServer node consumes high CPU utilization.
ps -eo pid,user,%cpu,cmd --sort=-%cpu
PID     USER     %CPU   CMD
124648  user_a   99.9   other_process
1332    user_b   50.5   observer
If another process also consumes high CPU utilization on the node, you need to contact the user who runs the process for adjustment.
Troubleshoot suspicious threads on an OBServer node
If only the observer process consumes high CPU utilization, run the top -H command to check whether the high CPU consumption is caused by tenant worker threads or background threads.
top -p `pidof observer` -H
If high CPU consumption is caused by worker threads
In 99% of scenarios, we need to only focus on regular threads, which are tenant worker threads instead of background threads, such as TNT_L0_G0_1001 in OceanBase Database V3.1 and T1001_L0_G0 in OceanBase Database V4.x.
By the way, worker threads are renamed in OceanBase Database V4.x because the
grepcommand often returns unwanted results in OceanBase Database V3.1 when you query worker threads by name. For example, when you run thegrep TNT_L0_G0_1command, the TNT_L0_G0_1001 thread may also be returned.
If a tenant executes SQL queries that consume a large amount of CPU resources and affect other tenants, you can run the top -H command to identify the tenant.
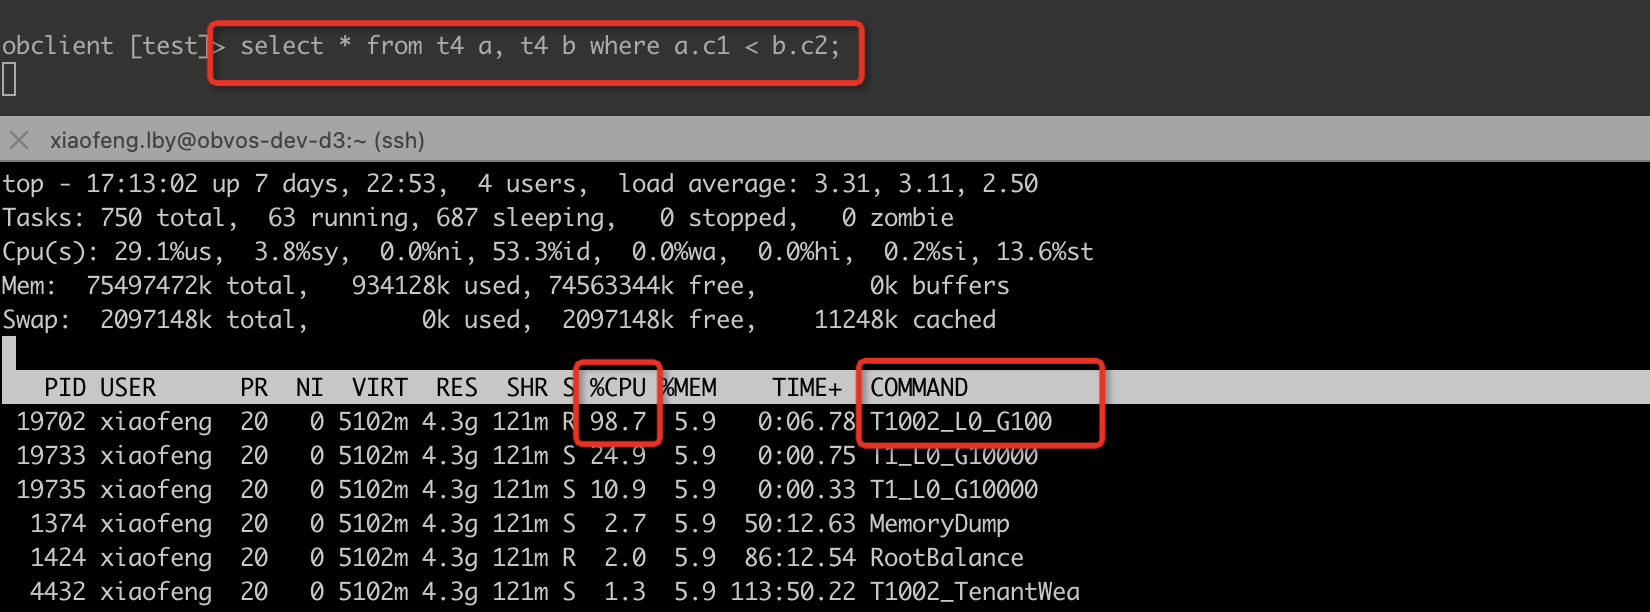
The preceding results indicate that tenant 1002 causes high CPU utilization.
Then, you can go to OceanBase Cloud Platform (OCP) to check which SQL query executed by tenant 1002 is consuming so many CPU resources.
Then, you need to analyze why the SQL query is special based on the knowledge in the previous topic.

If high CPU consumption is caused by background threads
If you find that high CPU utilization is caused by unfamiliar threads, such as T1_HBService, RootBalance, and IO_GETEVENT0, after you run the top -H command, we recommend that you submit your question in the OceanBase community forum and contact the engineers on duty to obtain technical support. The engineers will help you record stack traces by using obstack or pstack to identify the cause.
What's More
The above is all the content of this topic in the initial release version. The following content was added when we updated the topic.
After finishing writing this topic, I suddenly remembered that my superior once suggested that we could introduce the GUI-based monitoring feature of OCP to users, if possible.
I haven't written such content, as this feature is easy to learn and use. In most cases, you even do not need to read the official documentation.
I conducted a test to see whether I could analyze the cause of high CPU load by using OCP without referring to the official documentation, as shown in the following procedure. My attempt shows that you can easily use the GUI-based monitoring feature of OCP.
-
First, I increased the load on the database at 20:37 on November 21, 2024.
-
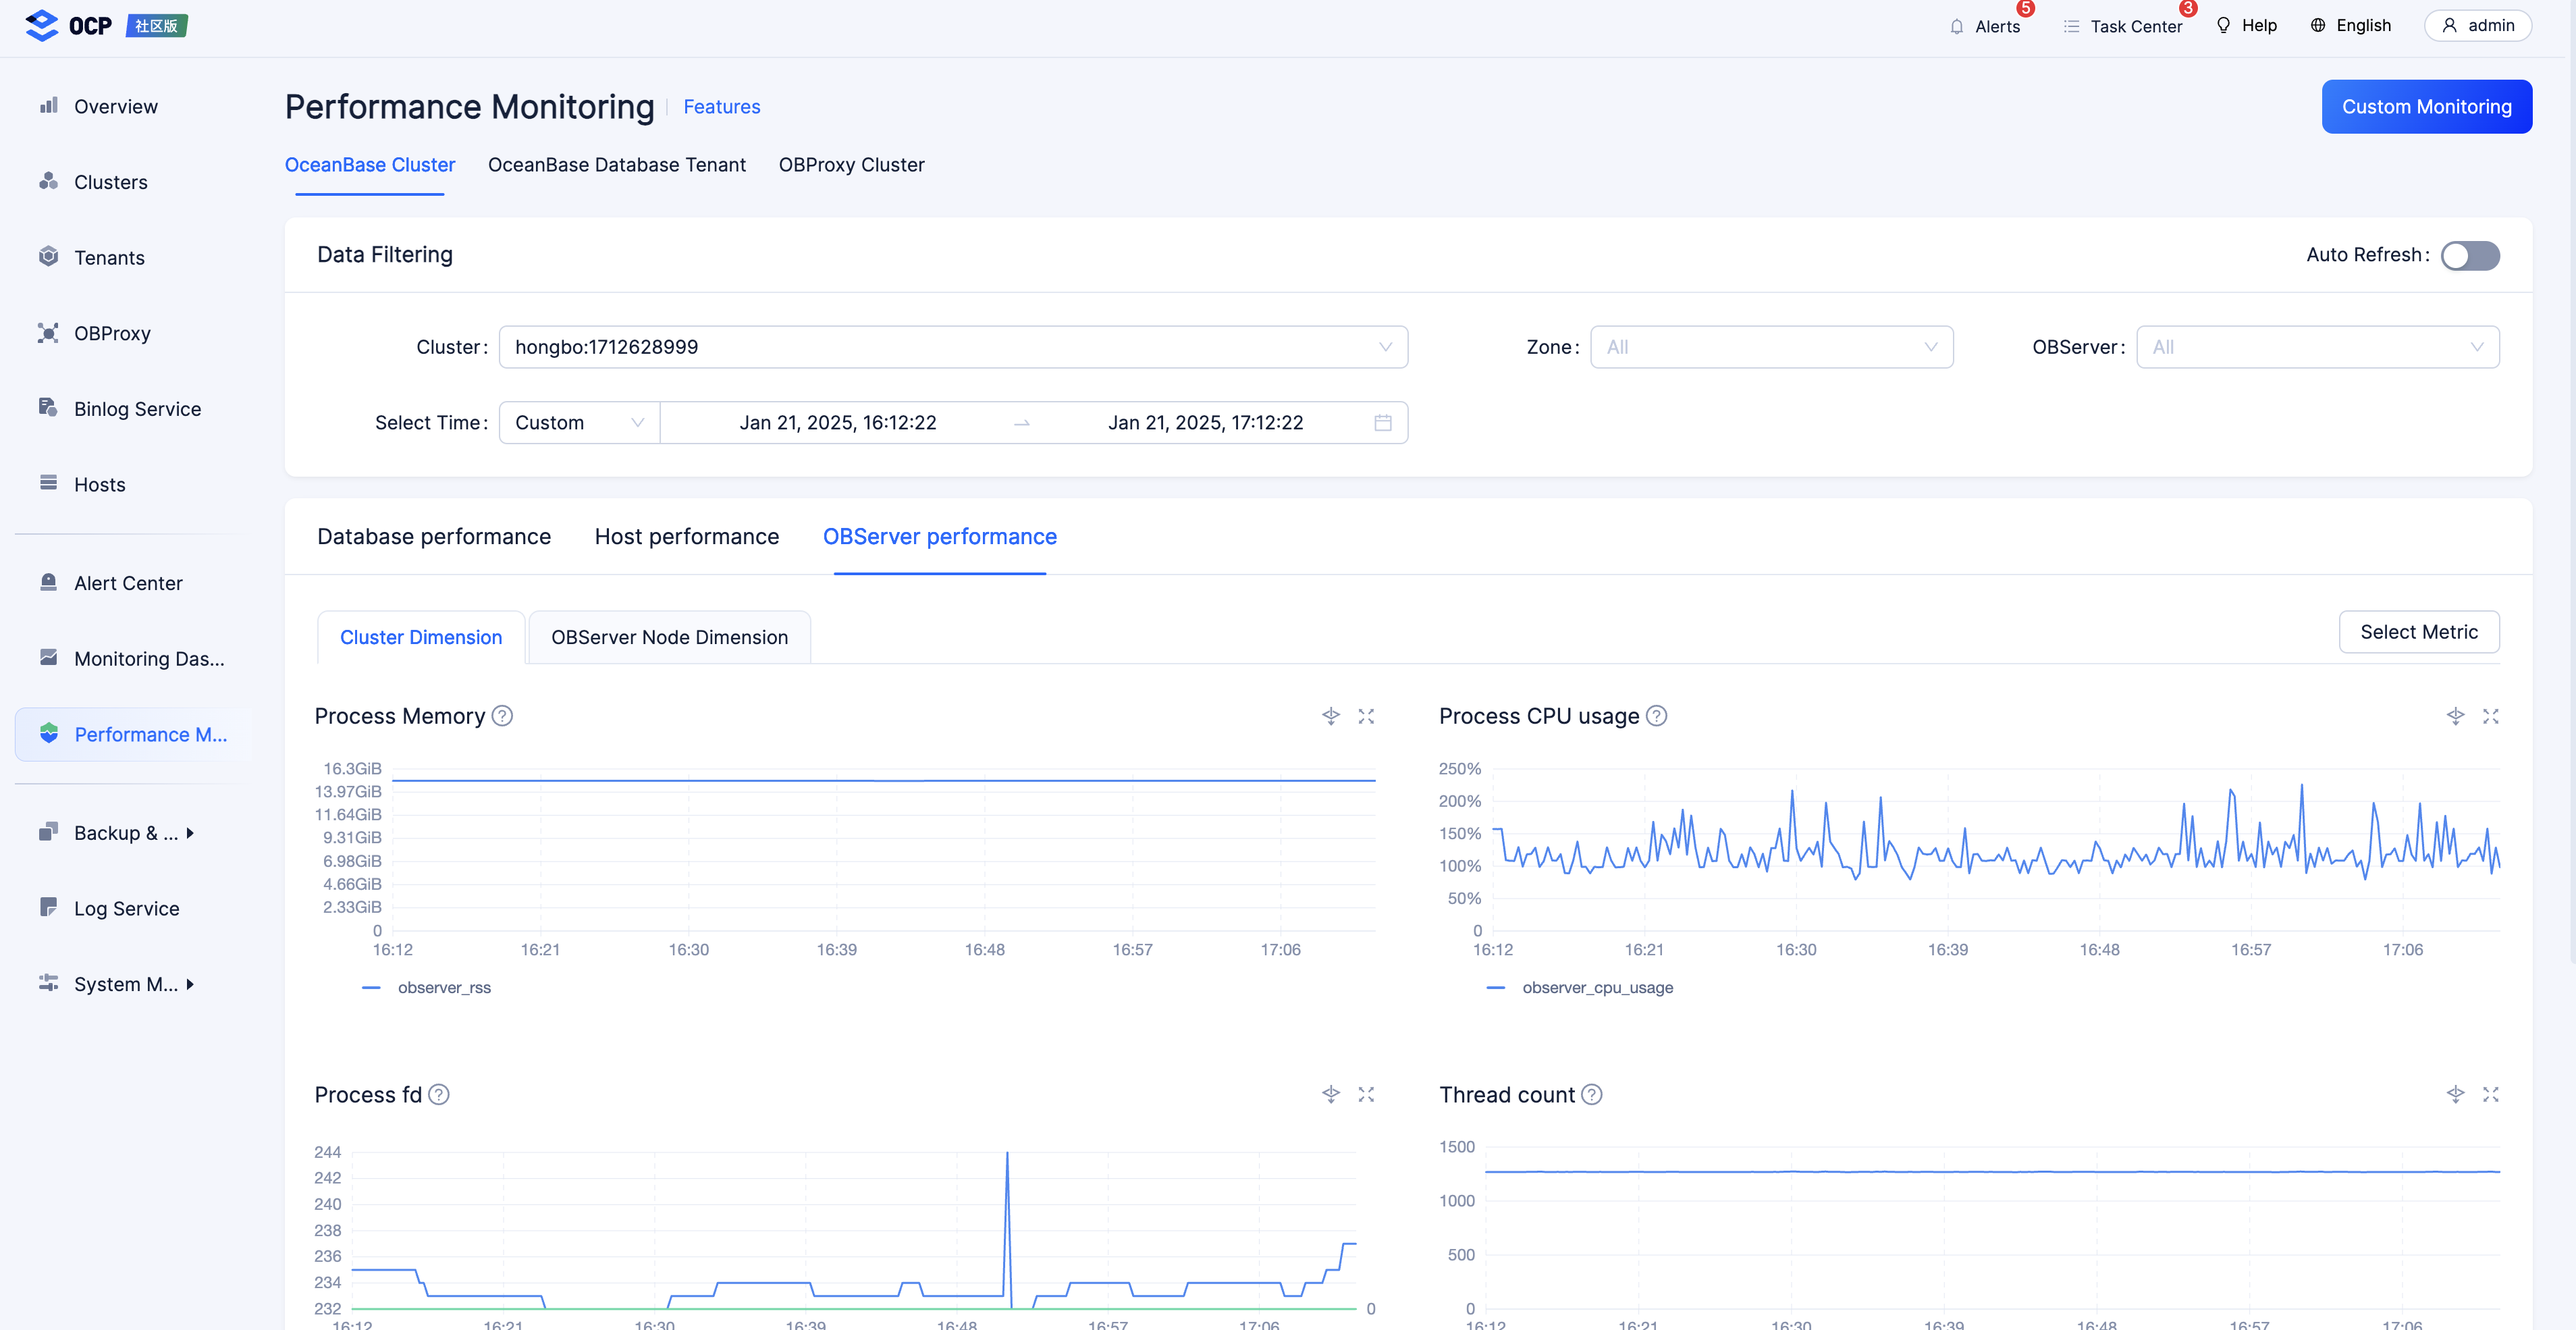
Then, I logged in to the OCP console, clicked Performance Monitoring in the left-side navigation pane, and clicked the OBServer node performance tab on the page that appeared. Since the load was increased, I found that the CPU utilization of the target cluster suddenly spiked and almost reached full capacity.
-
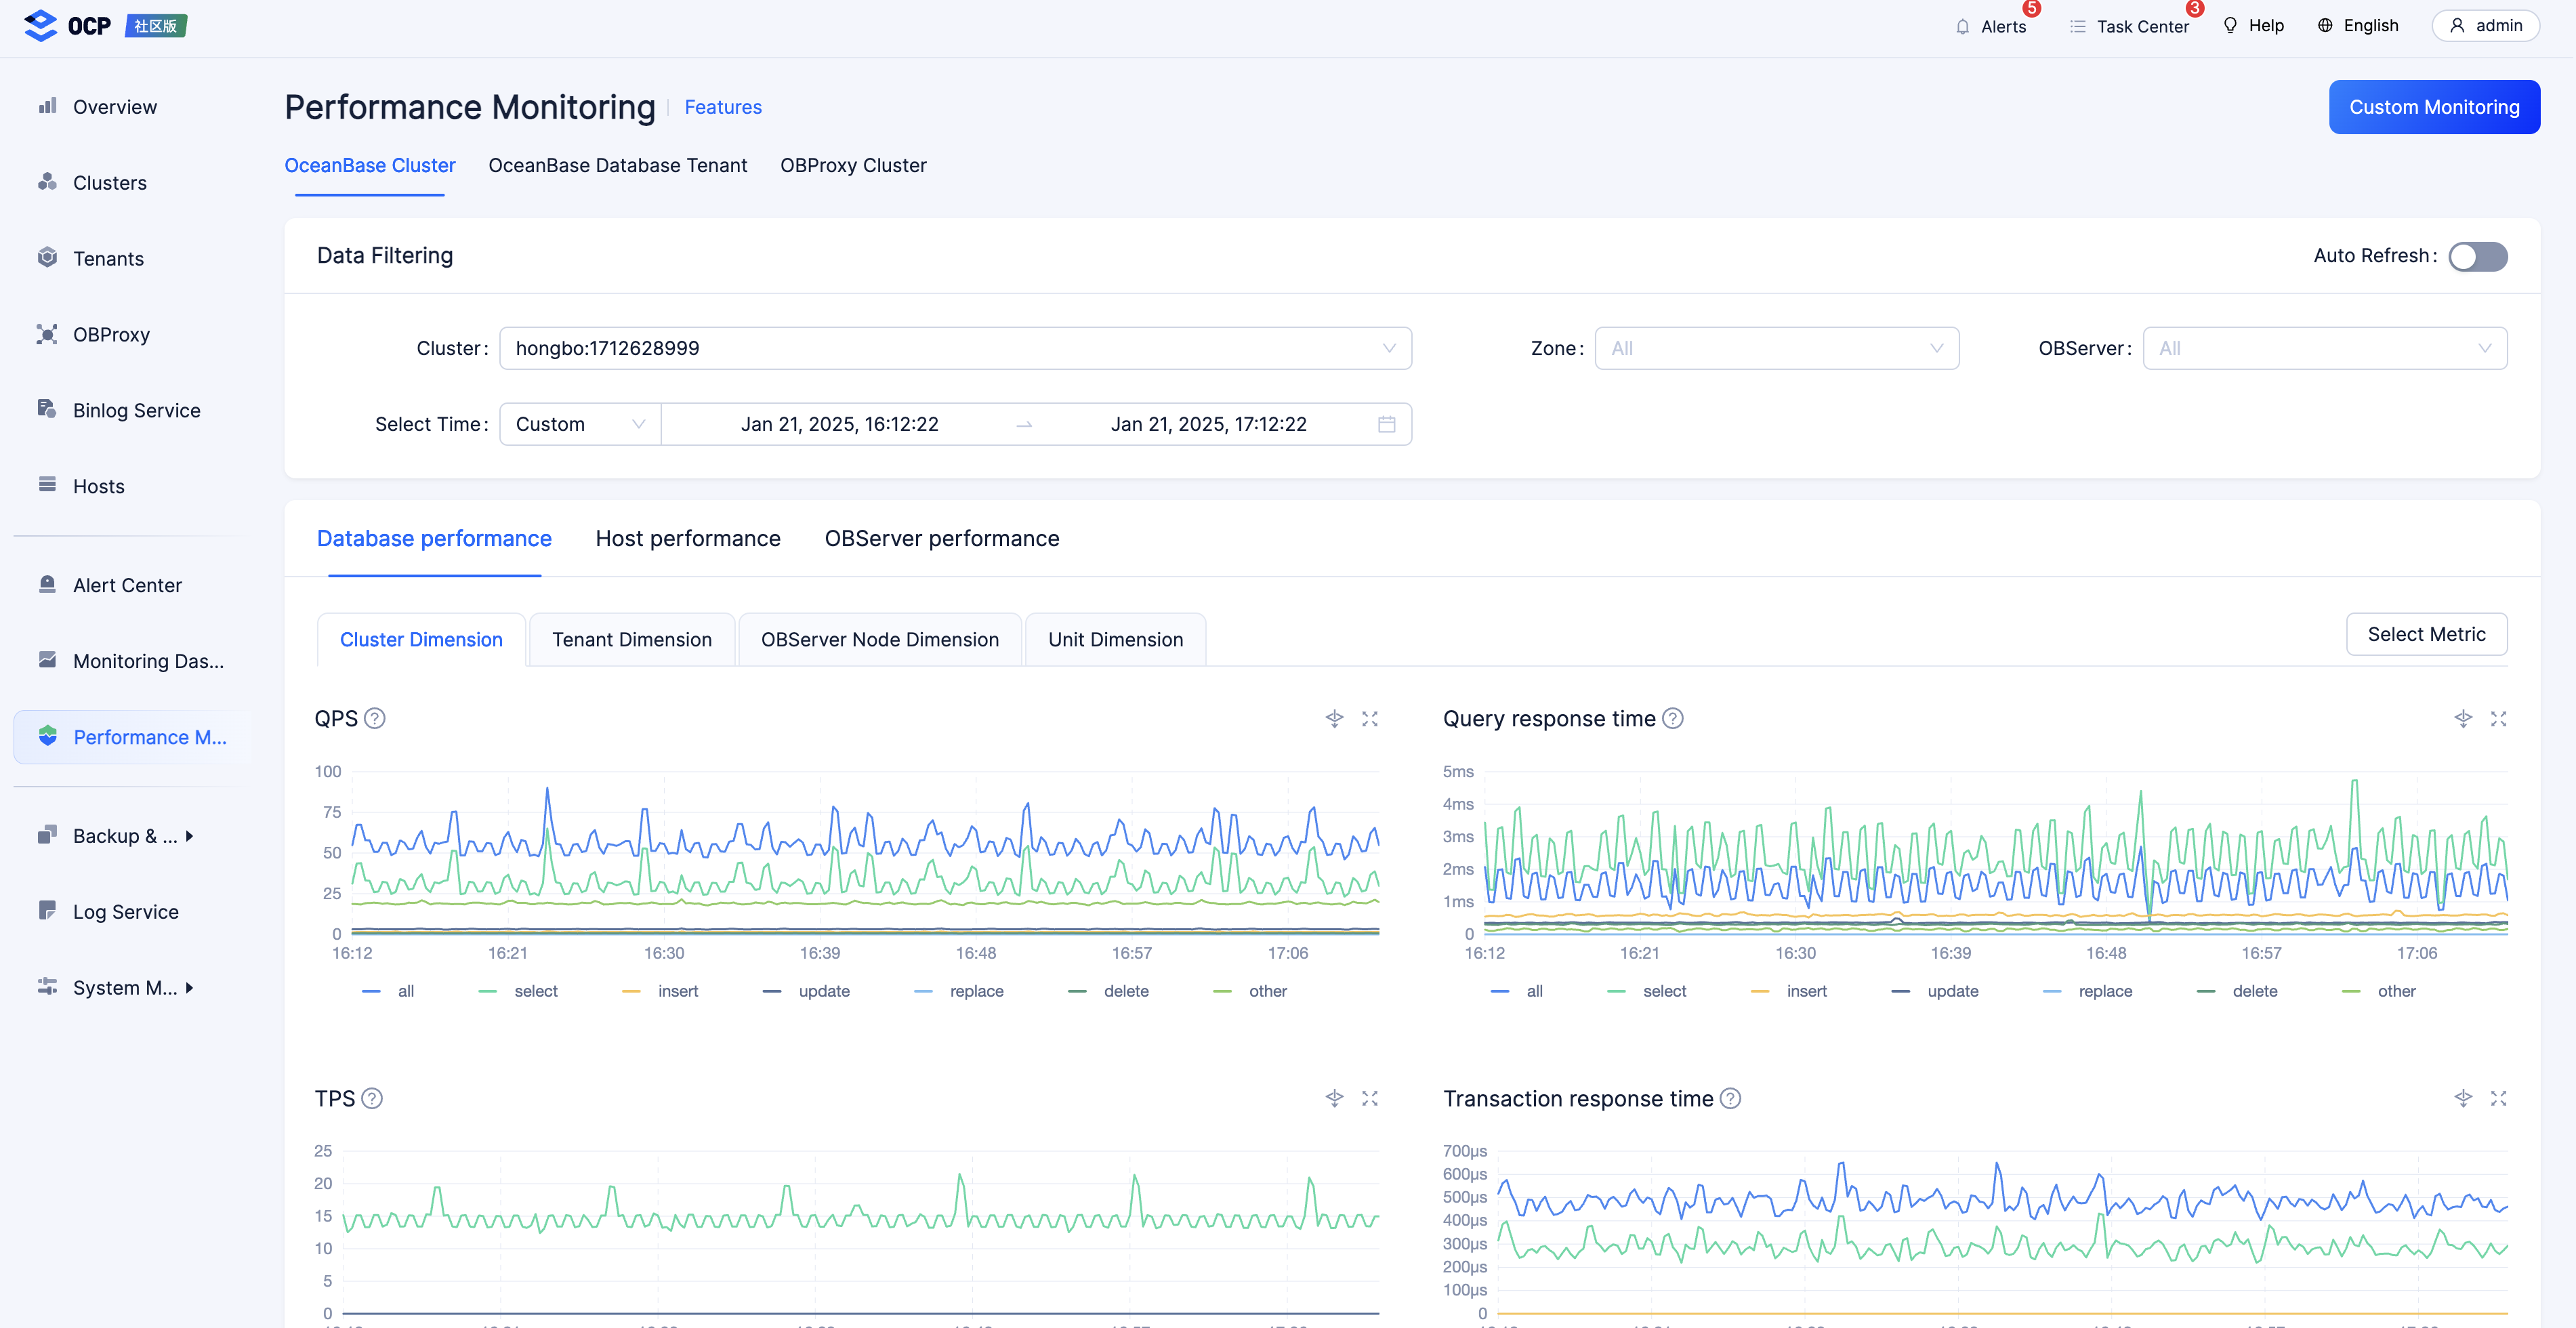
Next, I switched to the database performance tab and found that the SQL response time of the cluster also significantly increased.
-
Afterward, I switched to the tenant tab to view the monitoring metrics of each tenant in the cluster. I found that the
mysqltenant has high CPU utilization.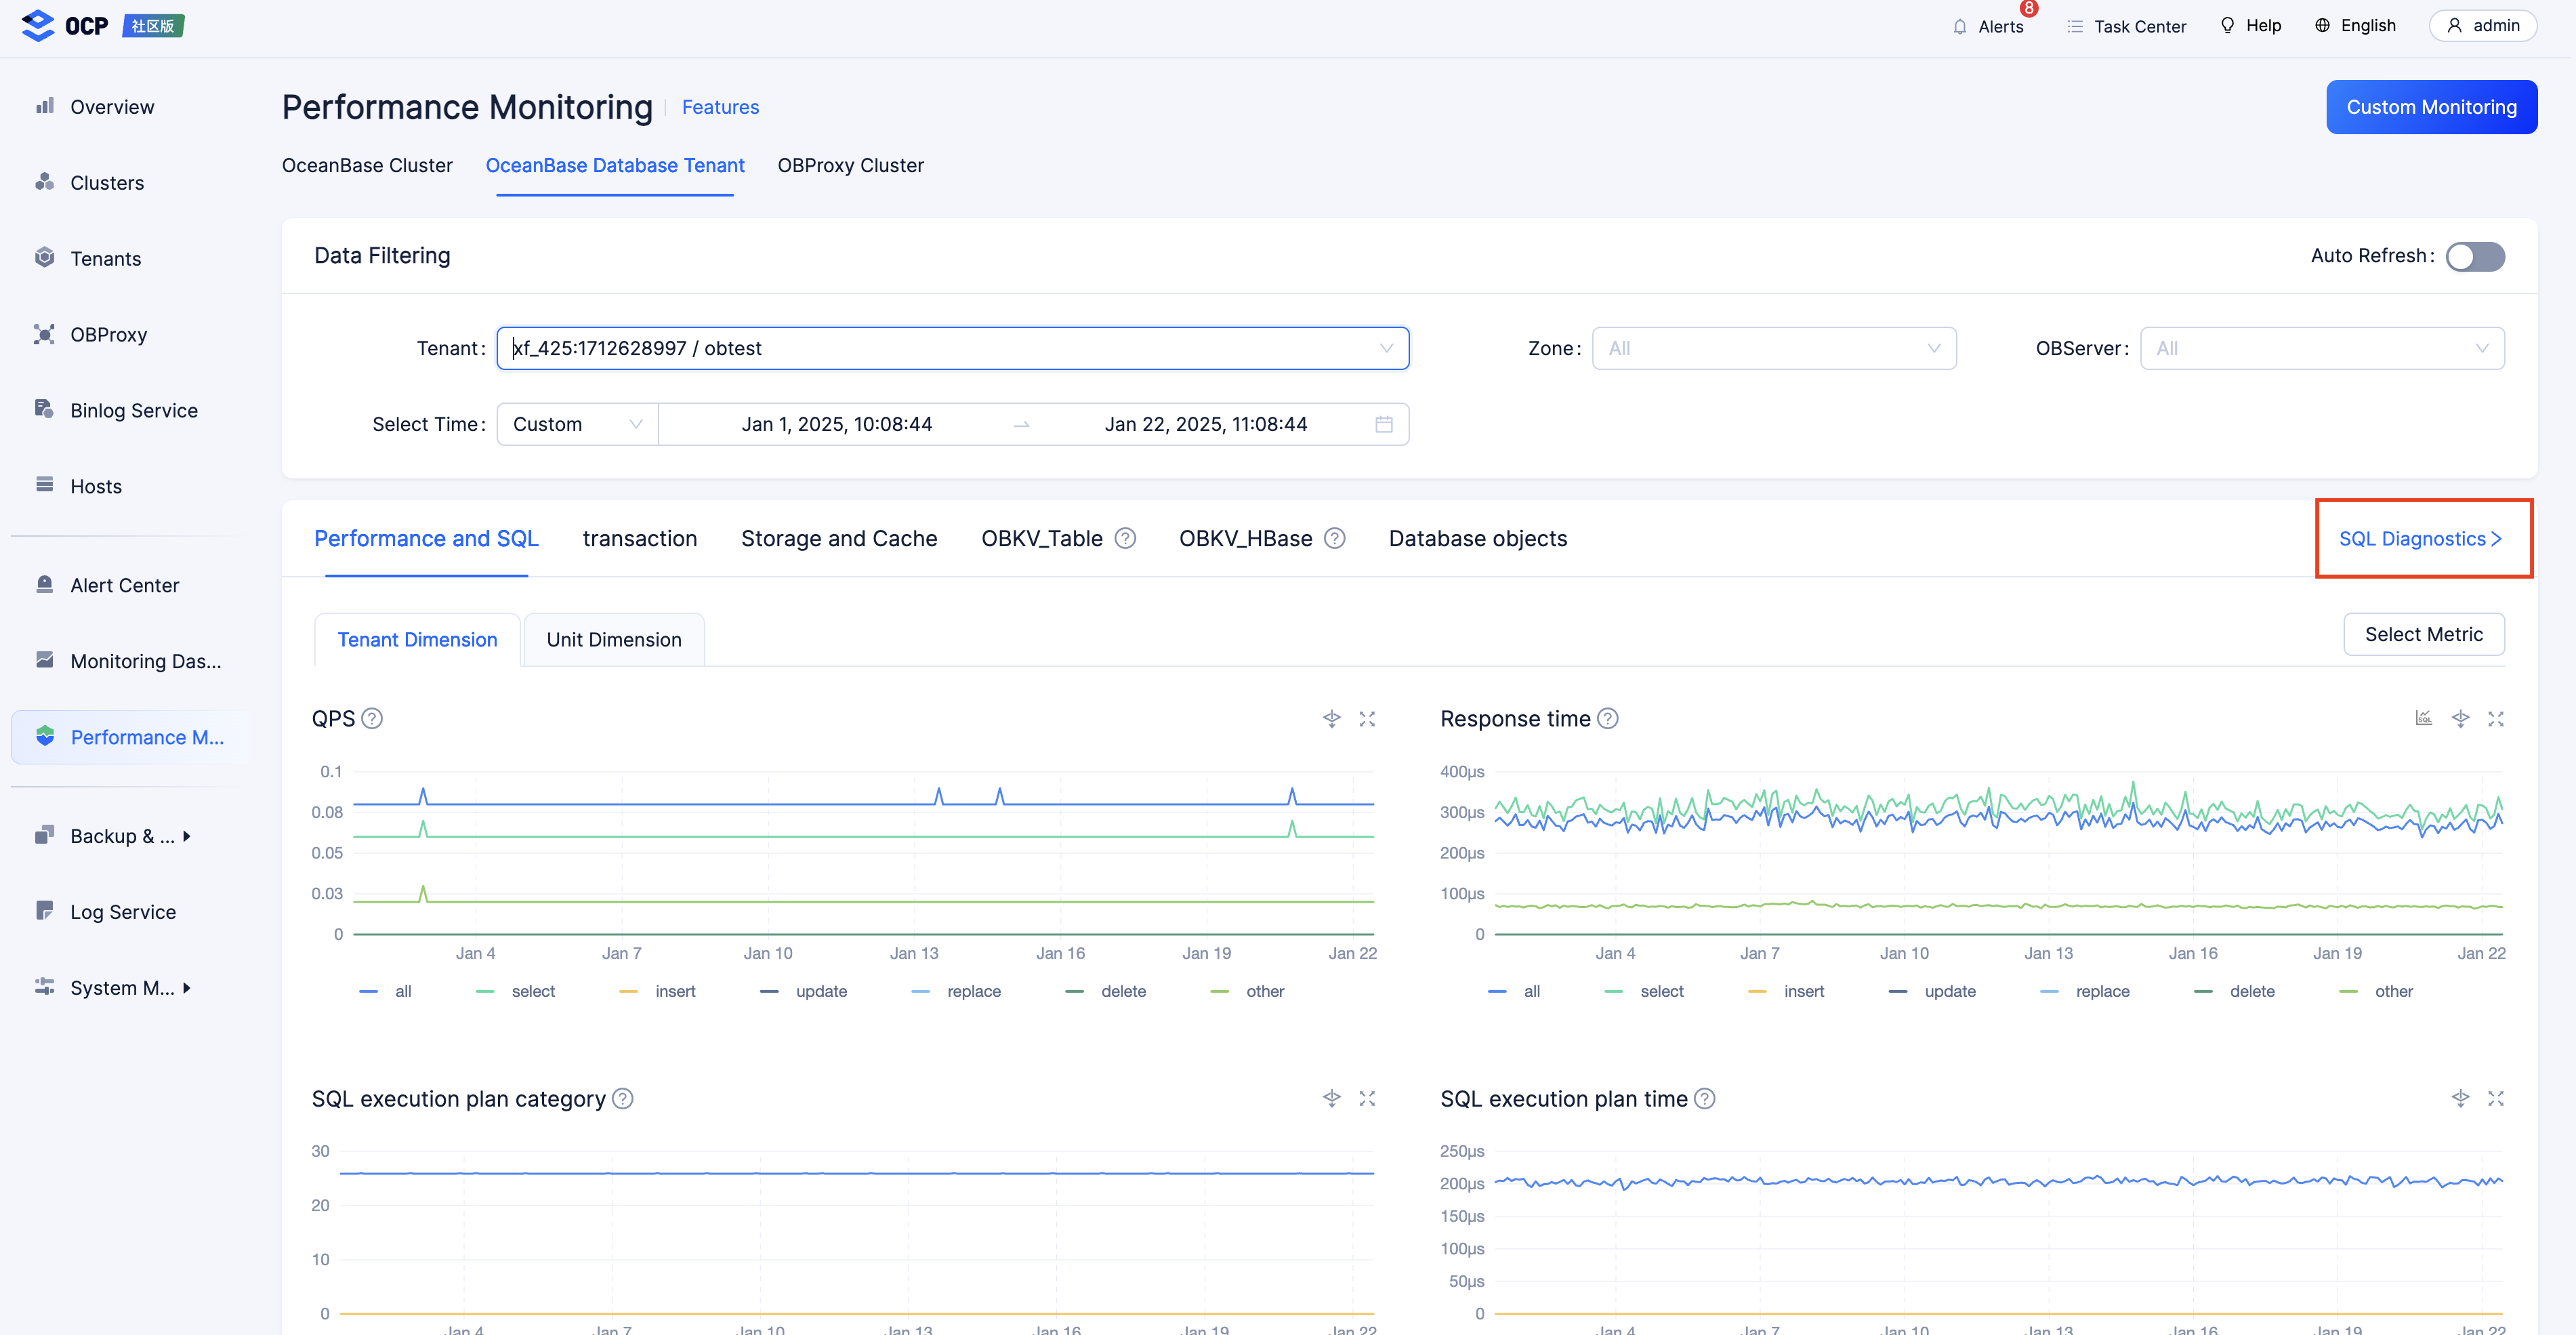
-
Then, I clicked SQL Diagnostics. The diagnostic results showed that the
mysqltenant is repeatedly executing an extremely complex SQL query.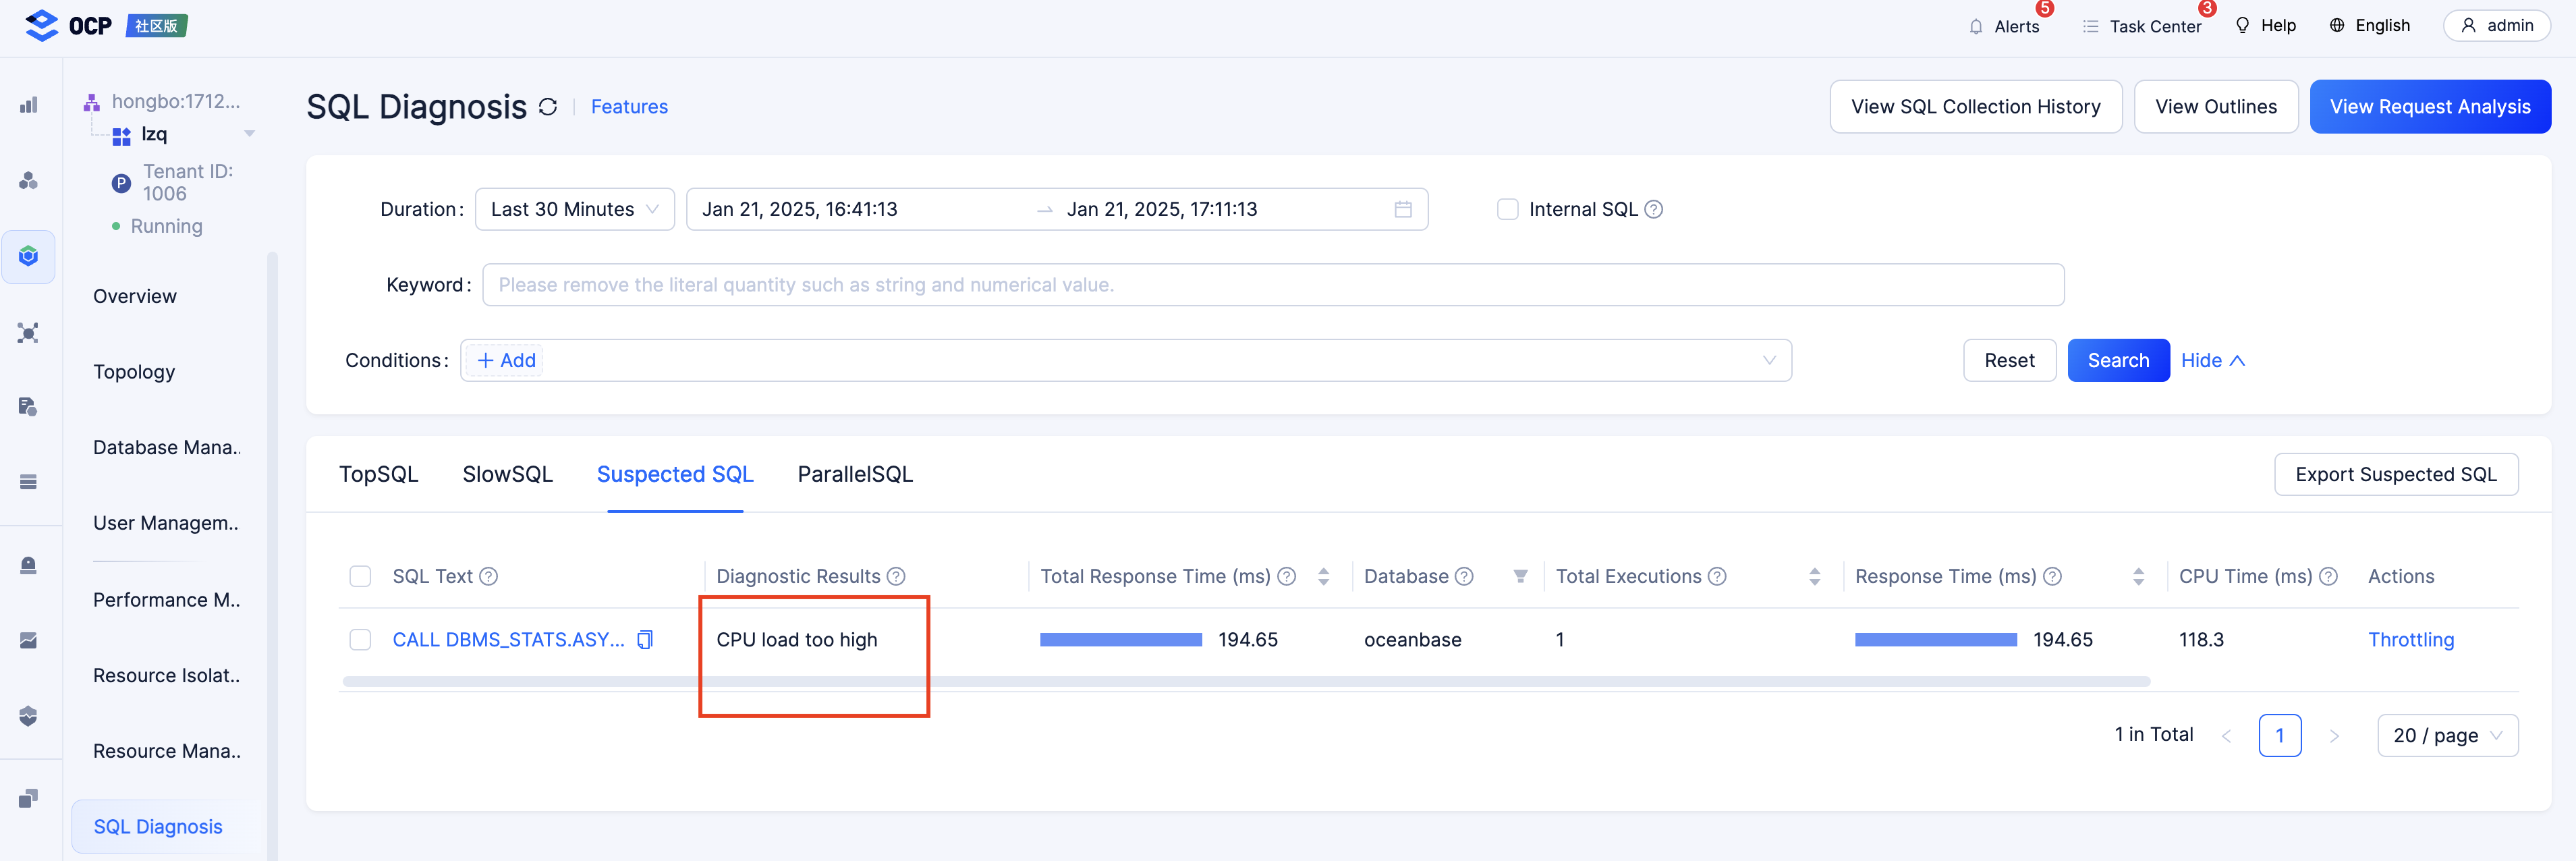
-
The cause was therefore identified.
Although the test was conducted on the premise that I already knew the cause of the fault, it still proves that you can use the GUI-based monitoring feature of OCP to troubleshoot high CPU utilization without the need to read the official documentation. Feel confident using this feature.