Troubleshoot ODP Connection Issues
When OceanBase Database Proxy (ODP) is used, the execution link of a request is as follows: a client sends a request to ODP, ODP routes the request to the corresponding OBServer node, the OBServer node processes the request and returns a response to ODP, and ODP forwards the response to the client.
A disconnection may occur on the link in the following cases: the client does not receive a response from ODP due to a long request processing time, login fails due to incorrect cluster or tenant information, or an internal error occurs in ODP or OceanBase Database.
Troubleshooting Procedure
We recommend that you carefully read this section. You can handle most exceptions according to logs retrieved based on trace IDs.
The troubleshooting procedure for ODP is similar to that for OBServer nodes.
For example, if a connection error occurs, check the error log.
[xiaofeng.lby@sqaobnoxdn011161204091.sa128 /home/xiaofeng.lby]
$obclient -h 127.0.0.1 -P2883 -uroot@sys#xiaofeng_91_435 -Dtest
ERROR 4669 (HY000): cluster not exist
This is not a very good example though. When the first error "cluster not exist" is returned, you already know what the problem is.
If you are not sure whether the problem is caused by ODP, you can run the grep "ret=-4669" * command in the /oceanbase/log directory. If the log directory contains many log files, replace the asterisk (*) behind grep with a specific log file name like observer.log.202412171219* based on the actual situation.
[xiaofeng.lby@sqaobnoxdn011161204091.sa128 /home/xiaofeng.lby/oceanbase/log]
$sudo grep "ret=-4669" *
If the grep command does not find any error information in the observer directory, the problem is probably caused by ODP. In this case, you can run the grep command in the /obproxy/log directory.
[xiaofeng.lby@sqaobnoxdn011161204091.sa128 /home/xiaofeng.lby/obproxy/log]
$grep "ret=-4669" *

# The output here is originally one line, and is manually split into multiple lines for display on the web page.
obproxy.log:[2024-12-17 14:34:14.024891]
WDIAG [PROXY.SM] setup_get_cluster_resource (ob_mysql_sm.cpp:1625)
[125907][Y0-00007F630AAA2A70] [lt=0] [dc=0]
cluster does not exist, this connection will disconnect
(sm_id=26403246, is_clustername_from_default=false, cluster_name=xiaofeng_91_435, ret=-4669)
You can see in the log that the cluster named xiaofeng_91_435 does not exist. Therefore, the disconnection occurs.
You can also obtain the trace ID [Y0-00007F630AAA2A70] from the preceding log. You can run the grep command based on this trace ID to obtain all logs related to this operation.
[xiaofeng.lby@sqaobnoxdn011161204091.sa128 /home/xiaofeng.lby/obproxy/log]
$grep Y0-00007F630AAA2A70 *

obproxy_diagnosis.log:[2024-12-17 14:34:14.024938] [125907][Y0-00007F630AAA2A70] [LOGIN](trace_type="LOGIN_TRACE", connection_diagnosis={cs_id:278640, ss_id:0, proxy_session_id:0, server_session_id:0, client_addr:"127.0.0.1:9988", server_addr:"*Not IP address [0]*:0", cluster_name:"xiaofeng_91_435", tenant_name:"sys", user_name:"root", error_code:-4669, error_msg:"cluster does not exist", request_cmd:"OB_MYSQL_COM_LOGIN", sql_cmd:"OB_MYSQL_COM_LOGIN", req_total_time(us):196}{internal_sql:"", login_result:"failed"})

obproxy_error.log:2024-12-17 14:34:14.024960,xiaofeng_cluster_430_proxy,,,,xiaofeng_91_435:sys:,OB_MYSQL,,,OB_MYSQL_COM_LOGIN,,failed,-4669,,194us,0us,0us,0us,Y0-00007F630AAA2A70,,127.0.0.1:9988,,0,,cluster not exist,

obproxy.log:[2024-12-17 14:34:13.584801] INFO  [PROXY.NET] accept (ob_mysql_session_accept.cpp:36) [125907][Y0-00007F630AAA2A70] [lt=0] [dc=0] [ObMysqlSessionAccept:main_event] accepted connection(netvc=0x7f630aa7d2e0, client_ip={127.0.0.1:9980})
...
After a disconnection occurs, ODP generates a disconnection log in the obproxy_diagnosis.log file to record detailed information about the disconnection. The following is a disconnection log that records a login failure due to an incorrect tenant name.
# The output here is originally one line, and is manually split into multiple lines for display on the web page.
[2023-08-23 20:11:08.567425]
[109316][Y0-00007F285BADB4E0] [CONNECTION]
(trace_type="LOGIN_TRACE",
connection_diagnosis={
    cs_id:1031798792, ss_id:0, proxy_session_id:0, server_session_id:0,
    client_addr:"10.10.10.1:58218", server_addr:"*Not IP address [0]*:0",
    cluster_name:"undefined", tenant_name:"test", user_name:"root",
    error_code:-4043,
    error_msg:"dummy entry is empty, please check if the tenant exists", request_cmd:"COM_SLEEP", sql_cmd:"COM_LOGIN"}{internal_sql:""})
You can guess the reason for the disconnection based on the please check if the tenant exists information in the error message.
The latter part of this topic is all "dictionary" content that you can consult when necessary. You only need to browse through the content to get a general idea.
We recommend that you add this topic to your favorites first. If an error occurs, pull the error log and search for the corresponding solution based on the key information provided in the log.
The general fields in an obproxy_diagnosis log are described as follows:
-
LOG_TIME: the time when the log was recorded, which is2023-08-23 20:11:08.567425in this example. -
TID: the ID of the thread, which is109316in this example. -
TRACE_ID: the trace ID, which isY0-00007F285BADB4E0in this example. You can associate the log with other logs based on the trace ID. -
CONNECTION: indicates that this log is related to connection diagnostics. -
trace_type: the diagnostic type, which varies based on the cause of disconnection. Valid values:-
LOGIN_TRACE: indicates that the disconnection is caused by a login failure. -
SERVER_INTERNAL_TRACE: indicates that the disconnection is caused by an internal error in OceanBase Database. -
PROXY_INTERNAL_TRACE: indicates that the disconnection is caused by an internal error in ODP. -
CLIENT_VC_TRACE: indicates that the disconnection is actively initiated by the client. -
SERVER_VC_TRACE: indicates that the disconnection is actively initiated by OceanBase Database. -
TIMEOUT_TRACE: indicates that the disconnection is caused by an execution timeout of the ODP process.
-
-
CS_ID: the internal ID used by ODP to identify the client connection. -
SS_ID: the internal ID used by ODP to identify the connection between ODP and OceanBase Database. -
PROXY_SS_ID: the ID generated by ODP to identify the client connection. This ID is passed to OceanBase Database and can be used to filter OceanBase Database logs or the sql_audit table. -
SERVER_SS_ID: the ID generated by OceanBase Database to identify the connection between ODP and OceanBase Database. -
CLIENT_ADDR: the IP address of the client. -
SERVER_ADDR: the IP address of the OBServer node where an error or disconnection occurs. -
CLUSTER_NAME: the name of the cluster. -
TENANT_NAME: the name of the tenant. -
USER_NAME: the username. -
ERROR_CODE: the error code. -
ERROR_MSG: the error message, which is the key information for diagnosing disconnections. -
REQUEST_CMD: the type of the statement being processed by ODP, which can be an internal request. -
SQL_CMD: the type of the user statement.
Besides the preceding general information, a diagnostic log can contain additional diagnostic information, which is subject to the diagnostic type.
General Disconnection Scenarios
This section describes several common disconnection scenarios and how to locate and resolve these disconnections.
Disconnection upon a login failure
The diagnostic type is LOGIN_TRACE. Here is a sample diagnostic log that records a disconnection caused by an incorrect tenant name during login.
[2023-09-08 10:37:21.028960] [90663][Y0-00007F8EB76544E0] [CONNECTION](trace_type="LOGIN_TRACE", connection_diagnosis={cs_id:1031798785, ss_id:0, proxy_session_id:0, server_session_id:0, client_addr:"10.10.10.1:44018", server_addr:"*Not IP address [0]*:0", cluster_name:"undefined", tenant_name:"sys", user_name:"root", error_code:-10018, error_msg:"fail to check observer version, empty result", request_cmd:"COM_SLEEP", sql_cmd:"COM_LOGIN"}{internal_sql:"SELECT ob_version() AS cluster_version"})
The additional diagnostic information is internal_sql, which indicates that an internal request is being processed by ODP.
The causes of a disconnection upon a login failure are complex. This section describes the causes and solutions from the perspectives of user operations and OceanBase Database.
The following table describes the disconnection scenarios of user operations and the corresponding solutions.
| Scenario | Error code | Error message | Solution |
|---|---|---|---|
| The cluster name is incorrect. | 4669 | cluster xxx does not exist | Make sure that the corresponding cluster exists and the cluster name is correct. You can directly connect to the OBServer node and run the show parameters like 'cluster'; command for verification. The value value in the output is the name of the cluster to connect to. |
| The tenant name is incorrect. | 4043 | dummy entry is empty, please check if the tenant exists | Make sure that the corresponding tenant exists. You can directly connect to the OBServer node as the root@sys user and execute the SELECT * FROM DBA_OB_TENANTS; statement to view all tenants in the cluster. |
| ODP allowlist verification fails. | 8205 | user xxx@xxx can not pass white list | Check whether ODP allowlists are correctly configured in the console. For more information, see "Allowlists" in OceanBase Cloud documentation. |
| OceanBase Database allowlist verification fails. | 1227 | Access denied | View the ob_tcp_invited_nodes variable to check whether OceanBase Database allowlists are correctly configured. |
| The number of client connections reaches the upper limit. | 5059 | too many sessions | Execute the ALTER proxyconfig SET <var_name> = <var_value>; statement to modify the ODP parameter client_max_connections to work around this issue. |
| ODP is configured to use the SSL protocol but a user request is initiated by using a non-SSL protocol. | 8004 | obproxy is configured to use ssl connection | Change the value of the enable_client_ssl parameter to false, which specifies not to use SSL for connections, or initiate an SSL access request. |
| The proxyro@sys user is used to directly access OceanBase Database. | 10021 | user proxyro is rejected while proxyro_check on | You cannot directly access OceanBase Database as the proxyro@sys user. |
A cloud user uses a username in the three-segment format for access when enable_cloud_full_user_name is disabled. | 10021 | connection with cluster name and tenant name is rejected while cloud_full_user_name_check off | A cloud user cannot use a username in the three-segment format for access when enable_cloud_full_user_name is disabled You can enable the enable_cloud_full_user_name parameter or access by using a regular username not in the three-segment format. |
| The password of the proxyro user is incorrect. | 10018 | fail to check observer version, proxyro@sys access denied, error resp { code:1045, msg:Access denied for user xxx } | If the default password for the proxyro user is retained, this error will not occur. If you manually change the password of the proxyro@sys user in OceanBase Database, make sure that the value of the ODP parameter observer_sys_password is the same as the new password of the proxyro@sys user. |
| The configured RootService list is unavailable when ODP is started. | 10018 | fail to check observer version, empty result | Directly connect to the OBServer node and execute the SHOW PARAMETERS LIKE 'rootservice_list'; statement to view RootService of OceanBase Database to check whether the configured server IP addresses are available when ODP is started. |
The following table describes the disconnection scenarios of OceanBase Database and the corresponding solutions.
| Scenario | Error code | Error message | Solution |
|---|---|---|---|
| The return result of a cluster information query is empty. | 4669 | cluster info is empty | Directly connect to OceanBase Database and execute an SQL statement. Then, view the internal_sql column in the output to check whether the cluster information returned from OceanBase Database is empty. |
| Cluster information query fails. | 10018 | fail to check observer version fail to check cluster info fail to init server state | Directly connect to OceanBase Database and execute an SQL statement. Then, view the internal_sql column in the output to check whether the cluster information returned from OceanBase Database is empty. |
| Information query on the config server fails. | 10301 | fail to fetch root server list from config server fail to fetch root server list from local | Manually pull the config server URL specified by the obproxy_config_server_url parameter at startup to check whether the information returned by the config server is normal. |
Disconnection upon timeout
The diagnostic type is TIMEOUT_TRACE. Here is a sample diagnostic log that records a disconnection caused by the timeout of cluster information.
[2023-08-17 17:10:46.834897] [119826][Y0-00007FBF120324E0] [CONNECTION](trace_type="TIMEOUT_TRACE", connection_diagnosis={cs_id:1031798785, ss_id:7, proxy_session_id:7230691830869983235, server_session_id:3221504994, client_addr:"10.10.10.1:42468", server_addr:"10.10.10.1:21100", cluster_name:"undefined", tenant_name:"sys", user_name:"root", error_code:-10022, error_msg:"OBProxy inactivity timeout", request_cmd:"COM_SLEEP", sql_cmd:"COM_END"}{timeout:1, timeout_event:"CLIENT_DELETE_CLUSTER_RESOURCE", total_time(us):21736})
The additional fields are described as follows:
-
timeout_event: indicates the timeout event. -
total_time: indicates the request execution time.
The following table describes how to resolve disconnections caused by different timeout events.
| Timeout event | Scenario | Error code | Related parameter | Solution |
|---|---|---|---|---|
| CLIENT_DELETE_CLUSTER_RESOURCE | The cluster information is changed. | 10022 | ODP parameter cluster_expire_time | Execute the ALTER proxyconfig SET <var_name> = <var_value>; statement to modify the ODP parameter cluster_expire_time to work around this issue. The default value of cluster_expire_time is 1 day. The modification takes effect for new requests. |
| CLIENT_INTERNAL_CMD_TIMEOUT | The execution of an internal request times out. | 10022 | Fixed value of 30s | This timeout event is abnormal. We recommend that you contact OceanBase Technical Support for help. |
| CLIENT_CONNECT_TIMEOUT | The connection establishment between the client and ODP times out. | 10022 | Fixed value of 10s | This timeout event is abnormal. We recommend that you contact OceanBase Technical Support for help. |
| CLIENT_NET_READ_TIMEOUT | A timeout event occurs when ODP waits for requested data. | 10022 | System variable net_read_timeout of OceanBase Database | Modify the system variable net_read_timeout. Note that the modification of a global system variable does not take effect for existing connections. |
| CLIENT_NET_WRITE_TIMEOUT | A timeout event occurs when ODP waits for a response packet. | 10022 | System variable net_write_timeout of OceanBase Database | Modify the system variable net_write_timeout. Note that the modification of a global system variable does not take effect for existing connections. |
| CLIENT_WAIT_TIMEOUT | The client connection times out after being left idle for a long period during a user request. | 10022 | System variable wait_timeout of OceanBase Database | Modify the system variable wait_timeout to work around this issue. |
| SERVER_QUERY_TIMEOUT | A user query request times out. | 10022 | System variable ob_query_timeout of OceanBase Database and query_timeout specified in a hint | Modify the ob_query_timeout system variable to work around this issue. |
| SERVER_TRX_TIMEOUT | The transaction execution times out. | 10022 | System variable ob_trx_timeout of OceanBase Database | Modify the ob_trx_timeout system variable to work around this issue. |
| SERVER_WAIT_TIMEOUT | The connection to OceanBase Database times out after being left idle for a long period during a user request. | 10022 | System variable wait_timeout of OceanBase Database | Modify the wait_timeout system variable to work around this issue. |
Disconnection initiated by OceanBase Database
The diagnostic type is SERVER_VC_TRACE. Here is a sample diagnostic log that records a disconnection when ODP fails to establish a connection with OceanBase Database.
[2023-08-10 23:35:00.132805] [32339][Y0-00007F74C9A244E0] [CONNECTION](trace_type="SERVER_VC_TRACE", connection_diagnosis={cs_id:838860809, ss_id:0, proxy_session_id:7230691830869983240, server_session_id:0, client_addr:"10.10.10.1:45765", server_addr:"", cluster_name:"undefined", tenant_name:"sys", user_name:"root", error_code:-10013, error_msg:"Fail to build connection to observer", request_cmd:"COM_QUERY", sql_cmd:"COM_HANDSHAKE"}{vc_event:"unknown event", total_time(us):2952626, user_sql:"select 1 from dual"})
The additional fields are described as follows:
-
vc_event: indicates the disconnection event. You do not need to be concerned about this field. -
total_time: indicates the request execution time. -
user_sql: indicates a user request.
The following table describes the scenarios of disconnection actively initiated by OceanBase Database and the corresponding solutions.
| Scenario | Error code | Error message | Solution |
|---|---|---|---|
| ODP fails to establish a connection with OceanBase Database. | 10013 | Fail to build connection to observer | Perform diagnostics based on relevant logs of OceanBase Database. |
| The connection is disconnected when ODP transmits a request to OceanBase Database. | 10016 | An EOS event received while proxy transferring request | Perform diagnostics based on relevant logs of OceanBase Database. |
| The connection is disconnected when ODP transmits the packet returned from OceanBase Database. | 10014 | An EOS event received while proxy reading response | Perform diagnostics based on relevant logs of OceanBase Database. |
Note
When OceanBase Database actively disconnects from ODP, ODP cannot collect detailed information. If the status of the OBServer node configured in ODP is normal, you need to perform diagnostics based on the relevant logs of OceanBase Database.
Disconnection initiated by the client
The diagnostic type is CLIENT_VC_TRACE. Here is a sample diagnostic log that records a disconnection initiated by the client when ODP reads the request.
[2023-08-10 23:28:24.699168] [32339][Y0-00007F74C9A244E0] [CONNECTION](trace_type="CLIENT_VC_TRACE", connection_diagnosis={cs_id:838860807, ss_id:26, proxy_session_id:7230691830869983239, server_session_id:3221698209, client_addr:"10.10.10.1:44701", server_addr:"10.10.10.1:21100", cluster_name:"undefined", tenant_name:"sys", user_name:"root", error_code:-10010, error_msg:"An EOS event received from client while obproxy reading request", request_cmd:"COM_SLEEP", sql_cmd:"COM_END"}{vc_event:"VC_EVENT_EOS", total_time(us):57637, user_sql:""})
The additional fields are described as follows:
-
vc_event: indicates the disconnection event. You do not need to concern about this field. -
total_time: indicates the request execution time. -
user_sql: indicates a user request.
The following table describes the scenarios of disconnection actively initiated by the client.
| Scenario | Error code | Error message | Solution |
|---|---|---|---|
| The client actively disconnects from ODP when ODP receives or sends a request. | 10010 | An EOS event received from client while obproxy reading request | Perform diagnostics based on relevant logs of the client. |
| The client actively disconnects from ODP when ODP processes a request. | 10011 | An EOS event received from client while obproxy handling response | Perform diagnostics based on relevant logs of the client. |
| The client actively disconnects from ODP when ODP returns a packet. | 10012 | An EOS event received from client while obproxy transferring response | Perform diagnostics based on relevant logs of the client. |
Note
When the client is disconnected from ODP, ODP cannot collect detailed information and records only the action of the client to actively disconnect from ODP. Active disconnections can be triggered by driver timeout, initiated by middleware such as Druid, HikariCP, and Nginx, or caused by network jitters. You can perform diagnostics based on relevant logs of the client.
Disconnection upon internal errors of ODP or OceanBase Database
The diagnostic type is PROXY_INTERNAL_TRACE for disconnections caused by internal errors of ODP, and is SERVER_INTERNAL_TRACE for disconnections caused by internal errors of OceanBase Database. Here is a sample diagnostic log that records a disconnection caused by an internal error of ODP.
[2023-08-10 23:26:12.558201] [32339][Y0-00007F74C9A244E0] [CONNECTION](trace_type="PROXY_INTERNAL_TRACE", connection_diagnosis={cs_id:838860805, ss_id:0, proxy_session_id:7230691830869983237, server_session_id:0, client_addr:"10.10.10.1:44379", server_addr:"", cluster_name:"undefined", tenant_name:"sys", user_name:"root", error_code:-10019, error_msg:"OBProxy reached the maximum number of retrying request", request_cmd:"COM_QUERY", sql_cmd:"COM_QUERY"}{user_sql:"USE `ý<8f>ý<91>ý<92>`"})
user_sql is an additional field that indicates the user request SQL.
The following table describes the scenarios of disconnections caused by internal errors of ODP or OceanBase Database and the corresponding solutions.
| Diagnostic type | Scenario | Error code | Error message | Solution |
|---|---|---|---|---|
| PROXY_INTERNAL_TRACE | The query for tenant partition information fails. | 4664 | dummy entry is empty, disconnect | This is an unexpected error scenario. You can contact OceanBase Technical Support for help or submit your question in the Q&A forum of the OceanBase community. |
| PROXY_INTERNAL_TRACE | The execution of some internal requests of ODP fails. | 10018 | proxy execute internal request failed, received error resp, error_type: xxx | This is an unexpected error scenario. You can contact OceanBase Technical Support for help or submit your question in the Q&A forum of the OceanBase community. |
| PROXY_INTERNAL_TRACE | The number of retries in ODP reaches the upper limit. | 10019 | OBProxy reached the maximum number of retrying request | This is an unexpected error scenario. You can contact OceanBase Technical Support for help or submit your question in the Q&A forum of the OceanBase community. |
| PROXY_INTERNAL_TRACE | The target session is closed in ODP. | 10001 | target session is closed, disconnect | This is an unexpected error scenario. You can contact OceanBase Technical Support for help or submit your question in the Q&A section forum of the OceanBase community. |
| PROXY_INTERNAL_TRACE | Other unexpected error scenarios | 10001 | The diagnostic information is empty. | This is an unexpected error scenario. You can contact OceanBase Technical Support for help or submit your question in the Q&A forum of the OceanBase community. |
| SERVER_INTERNAL_TRACE | A checksum verification error occurs. | 10001 | ora fatal error | This is an unexpected error scenario. You can contact OceanBase Technical Support for help or submit your question in the Q&A forum of the OceanBase community. |
| SERVER_INTERNAL_TRACE | A primary/standby switchover is performed. | 10001 | primary cluster switchover to standby, disconnect | During a primary/standby switchover, a disconnection is expected. |
Other scenarios
Besides the preceding scenarios, the following disconnection scenarios are expected and recorded in diagnostic logs. The diagnostic type is PROXY_INTERNAL_TRACE.
| Scenario | Error code | Error message | Remarks |
|---|---|---|---|
| The current session is killed. | 5065 | connection was killed by user self, cs_id: xxx | This is an expected scenario and is recorded in diagnostic logs. |
| Other sessions are killed. | 5065 | connection was killed by user session xxx | This is an expected scenario and is recorded in diagnostic logs. |
Here is a sample diagnostic log. user_sql is an additional field that indicates the user request SQL.
[2023-08-10 23:27:15.107427] [32339][Y0-00007F74CAAE84E0] [CONNECTION](trace_type="PROXY_INTERNAL_TRACE", connection_diagnosis={cs_id:838860806, ss_id:21, proxy_session_id:7230691830869983238, server_session_id:3221695443, client_addr:"10.10.10.1:44536", server_addr:"10.10.10.1:21100", cluster_name:"undefined", tenant_name:"sys", user_name:"", error_code:-5065, error_msg:"connection was killed by user self, cs_id: 838860806", request_cmd:"COM_QUERY", sql_cmd:"COM_QUERY"}{user_sql:"kill 838860806"})
Examples
The following figure shows the general links of requests initiated by a client to OceanBase Database.
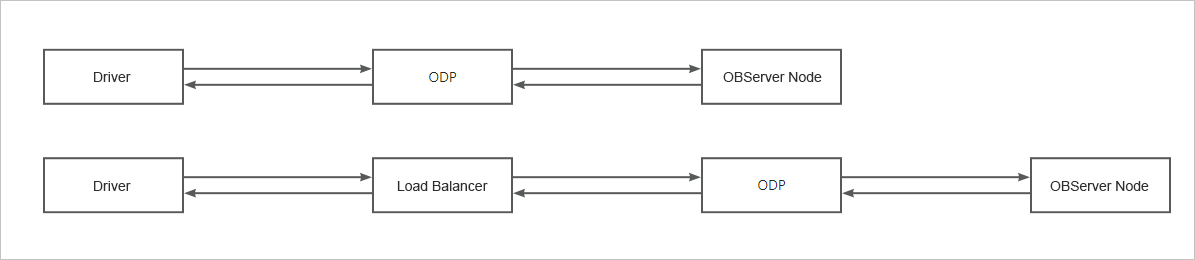
A request initiated by a client to OceanBase Database needs to pass multiple nodes. The client connection can be disconnected when an error occurs on any node. Therefore, when a connection is disconnected but the client does not receive any explicit error packet to indicate the cause of the disconnection, identify the node where the disconnection occurs and then find the cause based on the relevant logs on this node. Specifically, perform the following operations:
Step 1: Identify the node where the disconnection occurs
If the current ODP is capable of connection diagnostics, you can quickly identify the node where the disconnection occurs based on the obproxy_diagnosis.log file. You can quickly find the disconnection log based on information such as the username, tenant name, cluster name, thread ID (corresponding to cs_id in the log file) obtained from the driver, and the time when the disconnection occurred. Then, determine the node where the disconnection occurs based on the trace_type field. Valid values of trace_type are as follows:
-
CLIENT_VC_TRACE: indicates that the disconnection is initiated by the client. -
SERVER_VC_TRACE: indicates that the disconnection is initiated by OceanBase Database. -
SERVER_INTERNAL_TRACE: indicates that the disconnection is caused by an internal error in OceanBase Database. -
PROXY_INTERNAL_TRACE: indicates that the disconnection is caused by an internal error in ODP. -
LOGIN_TRACE: indicates that the disconnection is caused by a login failure. -
TIMEOUT_TRACE: indicates that the disconnection is caused by a timeout.
Step 2: Identify the cause of disconnection
You can identify the cause of the disconnection based on the node where the disconnection occurs.
Disconnection initiated by the client
The default value of socketTimeout is 0 for Java Database Connectivity (JDBC), which indicates that socket timeouts will not occur. However, some clients such as Druid and MyBatis have a socket timeout control parameter. If a disconnection occurs due to a long request execution time, you can first check the value of the socket timeout control parameter. For more information, see Database connection pool configuration in OceanBase Database documentation.
-
View basic information about the disconnection in the connection diagnostic logs of ODP.
[2023-09-07 15:59:52.308553] [122701][Y0-00007F7071D194E0] [CONNECTION](trace_type="CLIENT_VC_TRACE", connection_diagnosis={cs_id:524328, ss_id:0, proxy_session_id:7230691833961840700, server_session_id:0, client_addr:"10.10.10.1:38877", server_addr:"10.10.10.2:50110", cluster_name:"ob1.changluo.cc.10.10.10.2", tenant_name:"mysql", user_name:"root", error_code:-10011, error_msg:"An unexpected connection event received from client while obproxy handling request", request_cmd:"COM_QUERY", sql_cmd:"COM_QUERY"}{vc_event:"VC_EVENT_EOS", total_time(us):5016353, user_sql:"select sleep(20) from dual"})The fields in the diagnostic information are described as follows:
-
trace_type: the diagnostic type, which isCLIENT_VC_TRACEin this example, indicating that the disconnection is initiated by the client. -
error_msg: the error message, which isAn unexpected connection event received from client while obproxy handling requestin this example, indicating that the client initiates a disconnection when ODP processes a request. -
total_time: the request execution time, which is5016353in this example, indicating that the total request execution time is about 5s. You can check the timeout value on the client.
-
-
View the JDBC stack of the client.
The last packet successfully received from the server was 5,016 milliseconds ago.  The last packet sent successfully to the server was 5,011 milliseconds ago.
        at sun.reflect.NativeConstructorAccessorImpl.newInstance0(Native Method)
        at sun.reflect.NativeConstructorAccessorImpl.newInstance(NativeConstructorAccessorImpl.java:62)
        at sun.reflect.DelegatingConstructorAccessorImpl.newInstance(DelegatingConstructorAccessorImpl.java:45)
        at java.lang.reflect.Constructor.newInstance(Constructor.java:423)
        at com.mysql.jdbc.Util.handleNewInstance(Util.java:411)
        at com.mysql.jdbc.SQLError.createCommunicationsException(SQLError.java:1129)
        at com.mysql.jdbc.MysqlIO.reuseAndReadPacket(MysqlIO.java:3720)
        at com.mysql.jdbc.MysqlIO.reuseAndReadPacket(MysqlIO.java:3609)
        at com.mysql.jdbc.MysqlIO.checkErrorPacket(MysqlIO.java:4160)
        at com.mysql.jdbc.MysqlIO.sendCommand(MysqlIO.java:2617)
        at com.mysql.jdbc.MysqlIO.sqlQueryDirect(MysqlIO.java:2778)
        at com.mysql.jdbc.ConnectionImpl.execSQL(ConnectionImpl.java:2819)
        at com.mysql.jdbc.ConnectionImpl.execSQL(ConnectionImpl.java:2768)
        at com.mysql.jdbc.StatementImpl.execute(StatementImpl.java:949)
        at com.mysql.jdbc.StatementImpl.execute(StatementImpl.java:795)
        at odp.Main.main(Main.java:12)
Caused by: java.net.SocketTimeoutException: Read timed out
        at java.net.SocketInputStream.socketRead0(Native Method)
        at java.net.SocketInputStream.socketRead(SocketInputStream.java:116)
        at java.net.SocketInputStream.read(SocketInputStream.java:170)
        at java.net.SocketInputStream.read(SocketInputStream.java:141)
        at com.mysql.jdbc.util.ReadAheadInputStream.fill(ReadAheadInputStream.java:114)
        at com.mysql.jdbc.util.ReadAheadInputStream.readFromUnderlyingStreamIfNecessary(ReadAheadInputStream.java:161)
        at com.mysql.jdbc.util.ReadAheadInputStream.read(ReadAheadInputStream.java:189)
        at com.mysql.jdbc.MysqlIO.readFully(MysqlIO.java:3163)
        at com.mysql.jdbc.MysqlIO.reuseAndReadPacket(MysqlIO.java:3620)
     9 more
The stack and packet sending and receiving time indicate that the client initiates a disconnection due to socket timeout.
Disconnection initiated by ODP
ODP reads the net_write_timeout value from OceanBase Database to control the timeout value for packet transmission. The default value is 60s. In the case of extreme network environment conditions or if OceanBase Database does not return a packet after a long period of time, ODP may be disconnected due to a timeout. Here takes the scenario where a timeout occurs when ODP waits for a response packet from OceanBase Database as an example.
Determine the node where the disconnection occurs based on the diagnostic logs of ODP.
[2023-09-08 01:22:17.229436] [81506][Y0-00007F455197E4E0] [CONNECTION](trace_type="TIMEOUT_TRACE", connection_diagnosis={cs_id:1031798827, ss_id:342, proxy_session_id:7230691830869983244, server_session_id:3221753829, client_addr:"10.10.10.1:34901", server_addr:"10.10.10.1:21102", cluster_name:"undefined", tenant_name:"mysql", user_name:"root", error_code:-10022, error_msg:"OBProxy inactivity timeout", request_cmd:"COM_QUERY", sql_cmd:"COM_QUERY"}{timeout(us):6000000, timeout_event:"CLIENT_NET_WRITE_TIMEOUT", total_time(us):31165295})
The fields in the diagnostic information are described as follows:
-
trace_type: the diagnostic type, which isTIMEOUT_TRACEin this example, indicating that the disconnection occurs due to an execution timeout of ODP. -
timeout_event: the timeout event, which isCLIENT_NET_WRITE_TIMEOUTin this example, indicating that a timeout occurs when ODP waits for a response packet from OceanBase Database.
The diagnostic information indicates that net_write_timeout is triggered. The client connection is disconnected after being left idle for more than 6s (which is not the default value). In this case, you can change the timeout period to a larger value to work around this issue.
Login failure
This section provides two scenarios.
-
Scenario 1: The OBServer node specified in the RootService list is unavailable. Here is a sample diagnostic log.
[2023-09-08 10:37:21.028960] [90663][Y0-00007F8EB76544E0] [CONNECTION](trace_type="LOGIN_TRACE", connection_diagnosis={cs_id:1031798785, ss_id:0, proxy_session_id:0, server_session_id:0, client_addr:"10.10.10.1:44018", server_addr:"*Not IP address [0]*:0", cluster_name:"undefined", tenant_name:"sys", user_name:"root", error_code:-10018, error_msg:"fail to check observer version, empty result", request_cmd:"COM_SLEEP", sql_cmd:"COM_LOGIN"}{internal_sql:"SELECT ob_version() AS cluster_version"})The fields in the diagnostic information are described as follows:
-
trace_type: the diagnostic type, which isLOGIN_TRACEin this example, indicating that the disconnection is caused by a login failure. -
internal_sql: the internal request being processed by ODP, which isSELECT ob_version() AS cluster_versionin this example, indicating that ODP fails to execute this internal request during login. -
error_msg: the error message, which isfail to check observer version, empty resultin this example, indicating that the request execution failure is caused by an empty result set.
To sum up, ODP fails to execute the internal request
SELECT ob_version() AS cluster_versionbecause the result set is empty. The SQL statementSELECT ob_version() AS cluster_versionis a request for ODP to query the cluster version. ODP executes this request to verify the cluster information when you log in for the first time. If the RootService list configured when ODP is started is incorrect or if the OBServer node breaks down, the query will fail, thereby causing a login failure. -
-
Scenario 2: The number of client connections reaches the upper limit of ODP.
You can troubleshoot the issue by using the following methods:
-
Method 1: Check the connection diagnostic logs.
[2023-09-08 11:19:26.617385] [110562][Y0-00007FE1F06AC4E0] [CONNECTION](trace_type="LOGIN_TRACE", connection_diagnosis={cs_id:1031798805, ss_id:0, proxy_session_id:0, server_session_id:0, client_addr:"127.0.0.1:40004", server_addr:"*Not IP address [0]*:0", cluster_name:"undefined", tenant_name:"sys", user_name:"root", error_code:-5059, error_msg:"Too many sessions", request_cmd:"COM_SLEEP", sql_cmd:"COM_LOGIN"}{internal_sql:""})The fields in the diagnostic information are described as follows:
-
trace_type: the diagnostic type, which isLOGIN_TRACEin this example, indicating that the disconnection is caused by a login failure. -
error_msg: the error message, which isToo many sessionin this example, indicating that the login fails because the number of connections reaches the upper limit.
-
-
Method 2: Check the error message. The error message
Too many sessionsis returned when you run a connection command.$ obclient -h127.0.0.1 -P2899 -uroot@sys -Dtest -A -c
ERROR 1203 (42000): Too many sessions
-