Abstract
This document describes some methods to debug OceanBase. We have many ways to debug OceanBase, such as gdb, logging, etc.
We suggest you build OceanBase with debug mode as it is easy to debug.
GDB
GDB is a powerful debugging tool, but it is difficult to debug OceanBase by gdb and the scenarios are limited.
If you want to debug a single oceanbase process and single thread, you can use gdb, otherwise it is more recommended to use logging.
I suppose that you have already deployed the oceanbase built by source code.
Debugging oceanbase is similar to debugging other C++ programs, you can use gdb as the following:
- find the process id
ps -ef | grep observer
or
pidof observer
- attach the process
gdb observer <pid>
Then you can set breakpoint, print variable, etc. Please refer to gdb manual for more information.
Debug oceanbase with debug-info package
If you want to debug oceanbase or check the coredump file deployed with oceanbase rpm, you should install or load the debug-info package first. Loading is more recommended although installation is more convenient as there will be many debug-info packages in the system and it is not easy to cleanup.
First, obtain the debug-info package from the website, and then load the package into gdb. Afterward, you will be able to debug OceanBase with ease.
Below are some tips.
How to find debug-info package
You can get the package revision by the command below.
# in the observer runtime path
clusters/local/bin [83] $ ./observer -V
./observer -V
observer (OceanBase_CE 4.1.0.1)

REVISION: 102000042023061314-43bca414d5065272a730c92a645c3e25768c1d05
BUILD_BRANCH: HEAD
BUILD_TIME: Jun 13 2023 14:26:23
BUILD_FLAGS: RelWithDebInfo
BUILD_INFO:

Copyright (c) 2011-2022 OceanBase Inc.
If you see the error below
./observer -V
./observer: error while loading shared libraries: libmariadb.so.3: cannot open shared object file: No such file or directory
You can run command below to get the revision
clusters/local/bin [83] $ LD_LIBRARY_PATH=../lib:$LD_LIBRARY_PATH ./observer -V
./observer -V
observer (OceanBase_CE 4.1.0.1)

REVISION: 102000042023061314-43bca414d5065272a730c92a645c3e25768c1d05
BUILD_BRANCH: HEAD
BUILD_TIME: Jun 13 2023 14:26:23
BUILD_FLAGS: RelWithDebInfo
BUILD_INFO:

Copyright (c) 2011-2022 OceanBase Inc.
Download debug-info package
From the version information above, we can get the first field of the revision. That is
REVISION: 102000042023061314-43bca414d5065272a730c92a645c3e25768c1d05
We need 102000042023061314.
Then we search 102000042023061314 on the oceanbase rpm website like below.
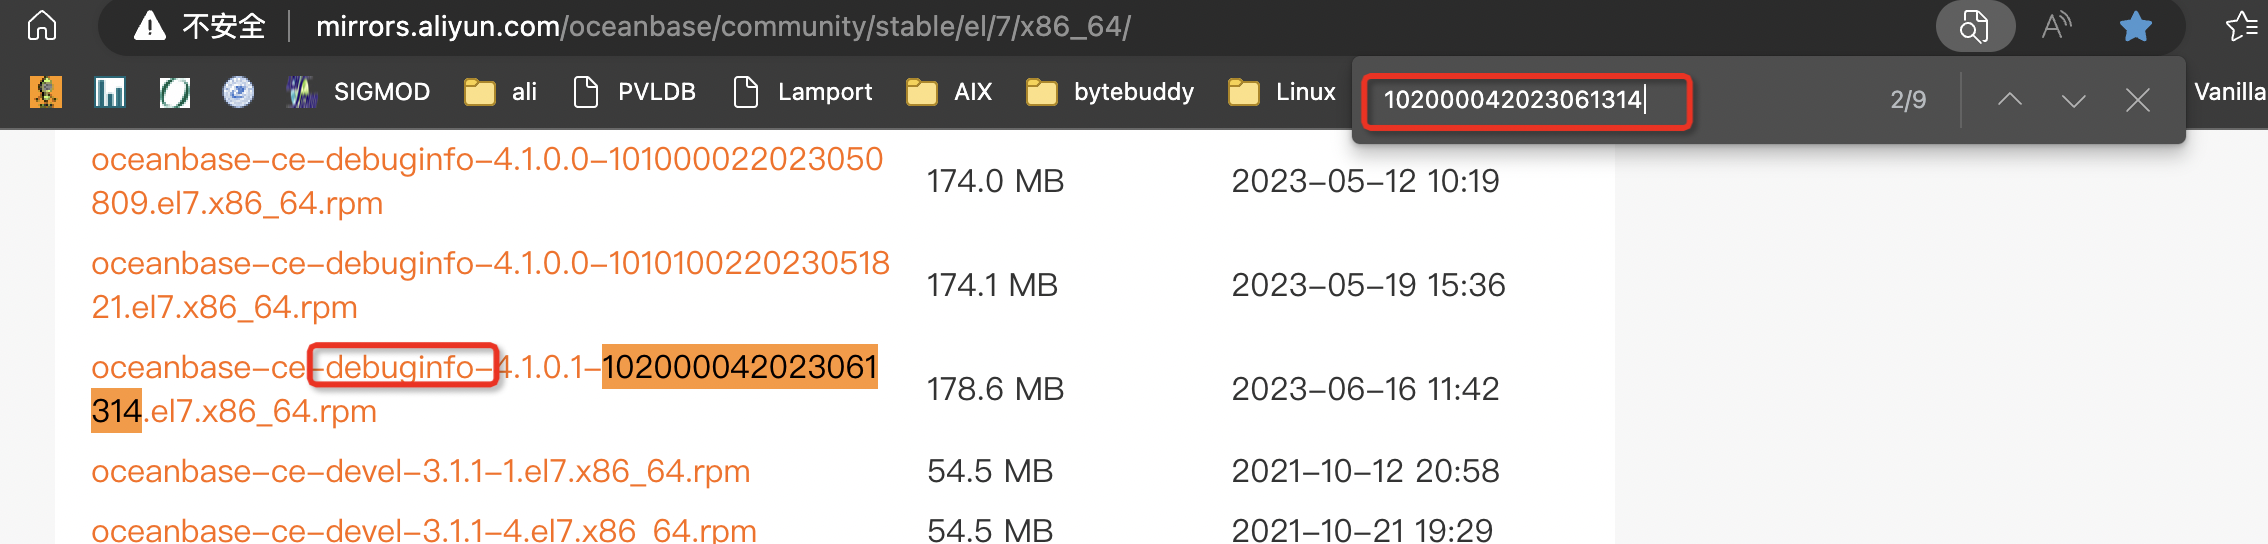
Here is a rpm website list.
Extract debug-info package from rpm
Extract debug-info package from rpm, for example.
rpm2cpio oceanbase-ce-debuginfo-4.1.0.1-102000042023061314.el7.x86_64.rpm | cpio -div
Then you can get this.
~/tmp/debug-info [83] $ tree -a
.
└── usr
    └── lib
        └── debug
            ├── .build-id
            │   └── ee
            │       ├── f87ee72d228069aab083d8e6d2fa2fcb5c03f2 -> ../../../../../home/admin/oceanbase/bin/observer
            │       └── f87ee72d228069aab083d8e6d2fa2fcb5c03f2.debug -> ../../home/admin/oceanbase/bin/observer.debug
            └── home
                └── admin
                    └── oceanbase
                        └── bin
                            └── observer.debug
observer.debug is the debug-info package we need and f87ee72d228069aab083d8e6d2fa2fcb5c03f2.debug is a symbolic link.
Debug oceanbase with debug-info package
Now, you can attach a process or a coredump file with gdb with commands below.
# attach a process
gdb ./observer `pidof observer`
or
# open a coredump file
gdb ./observer <coredump file name>
Usually, you will get this message.
Type "apropos word" to search for commands related to "word"...
Reading symbols from clusters/local/bin/observer...
(No debugging symbols found in clusters/local/bin/observer)
Attaching to program: clusters/local/bin/observer, process 57296
This means that there are no debugging symbols.
If we run some debug command in gdb, such as bt, we could get this.
(gdb) bt
#0  0x00007fb6e9c36d62 in pthread_cond_timedwait@@GLIBC_2.3.2 () from /lib64/libpthread.so.0
#1  0x00007fb6f9f44862 in ob_pthread_cond_timedwait ()
#2  0x00007fb6eee8d206 in oceanbase::common::ObThreadCond::wait_us(unsigned long) ()
#3  0x00007fb6f34b21c8 in oceanbase::observer::ObUniqTaskQueue<oceanbase::observer::ObServerSchemaTask, oceanbase::observer::ObServerSchemaUpdater>::run1() ()
#4  0x00007fb6f9f44259 in oceanbase::lib::Threads::run(long) ()
#5  0x00007fb6f9f40aca in oceanbase::lib::Thread::__th_start(void*) ()
We cannot get the source code file name or function parameters information.
Let's load the debug-info package.
(gdb) symbol-file usr/lib/debug/home/admin/oceanbase/bin/observer.debug
Reading symbols from usr/lib/debug/home/admin/oceanbase/bin/observer.debug...
It's better to use the full path of the debug info file.
Let's run the debug command again and we can get detailed information.
(gdb) bt
#0  0x00007fb6e9c36d62 in pthread_cond_timedwait@@GLIBC_2.3.2 () from /lib64/libpthread.so.0
#1  0x00007fb6f9f44862 in ob_pthread_cond_timedwait (__cond=0x7fb6fb1d5340, __mutex=0x7fb6fb1d5318, __abstime=0x7fb6b3ed41d0)
    at deps/oblib/src/lib/thread/ob_tenant_hook.cpp:124
#2  0x00007fb6eee8d206 in oceanbase::common::ObThreadCond::wait_us (this=<optimized out>, time_us=140422679606016)
    at deps/oblib/src/lib/lock/ob_thread_cond.cpp:106
#3  0x00007fb6f34b21c8 in oceanbase::common::ObThreadCond::wait (this=0x7fb6fb1d5310, time_ms=200)
    at deps/oblib/src/lib/lock/ob_thread_cond.h:69
#4  oceanbase::observer::ObUniqTaskQueue<oceanbase::observer::ObServerSchemaTask, oceanbase::observer::ObServerSchemaUpdater>::run1 (
    this=<optimized out>) at src/observer/ob_uniq_task_queue.h:417
Logging
Logging is the most common way to debug OceanBase, and it is easy to use and can be used in most scenarios. In common scenarios, we can add logs in the code and print the variable, then rebuild and redeploy the oceanbase.
How to add logs
You can prefer the logging code in the source code, such as
LOG_DEBUG("insert sql generated", K(insert_sql));
Here LOG_DEBUG is a macro to print log in debug level.
You can see that it is a little different from other programs. The first parameter is a string, and the other parameters are usually K(variable_name). K is a macro to print the variable name and value.
How to search logs
The logs are stored in the log directory which is under the home_path directory. You can search the logs by grep command.
Below is a log example:
[2023-07-05 16:40:42.635136] INFO [SQL.EXE] explicit_start_trans (ob_sql_trans_control.cpp:194) [88022][T1003_ArbSer][T1003][YD9F97F000001-0005FFB71FCF95C7-0-0] [lt=42] start_trans(ret=0, tx_id={txid:2118151}, session={this:0x7ff2663d6188, id:1, tenant:"sys", tenant_id:1, effective_tenant:"sys", effective_tenant_id:1003, database:"oceanbase", user:"root@%", consistency_level:3, session_state:0, autocommit:true, tx:0x7ff26b0e4300}, read_only=false, ctx.get_execution_id()=18446744073709551615)
You can see the timestamp([2023-07-05 16:40:42.635136]), log level(INFO), module name([SQL.EXE]), function name(explicit_start_trans), file(ob_sql_trans_control.cpp), line number(194), thread id(88022), thread name(T1003_ArbSer), trace id(YD9F97F000001-0005FFB71FCF95C7-0-0), etc.
The trace id is a unique id for each SQL request. You can search a specific trace id to find all logs about this SQL request.
Tips with logging
Trace ID
You can use the SQL command below to get the trace id of the last SQL request.
select last_trace_id();
Log Level
You can use the SQL command below to adjust the log level dynamically.
set ob_log_level=debug;
Log Traffic Control
If you can not find your log, it may be limited because of the log traffic control, you can use the SQL command below to change the behavior of the log traffic control.
alter system set syslog_io_bandwidth_limit='1G';
alter system set diag_syslog_per_error_limit=1000;
Print Log Synchronously
You can use SQL command below to print log synchronously.
alter system set enable_async_syslog='False';
Print Call Stack
You can print the call stack information in the log, such as:
LOG_DEBUG("insert sql generated", K(insert_sql), K(lbt()));
You may got this:
lbt()="0x14371609 0xe4ce783 0x54fd9b6 0x54ebb1b 0x905e62e 0x92a4dc8 0x905df11 0x905dc94 0x13d2278e 0x13d22be3 0x6b10b81 0x6b0f0f7 0x62e2491 0x10ff6409 0x1475f87a 0x10ff6428 0x1475f1c2 0x1476ba83 0x14767fb5 0x14767ae8 0x7ff340250e25 0x7ff33fd0ff1d"
Then you can use the command below to get the call stack information:
addr2line -pCfe ./bin/observer 0x14371609 0xe4ce783 0x54fd9b6 0x54ebb1b 0x905e62e 0x92a4dc8 0x905df11 0x905dc94 0x13d2278e 0x13d22be3 0x6b10b81 0x6b0f0f7 0x62e2491 0x10ff6409 0x1475f87a 0x10ff6428 0x1475f1c2 0x1476ba83 0x14767fb5 0x14767ae8 0x7ff340250e25 0x7ff33fd0ff1d
I got this:
oceanbase::common::lbt() at /home/distcc/tmp/./deps/oblib/src/lib/utility/ob_backtrace.cpp:130 (discriminator 2)
operator() at /home/distcc/tmp/./src/sql/session/ob_basic_session_info.cpp:599 (discriminator 2)
oceanbase::sql::ObBasicSessionInfo::switch_tenant(unsigned long) at /home/distcc/tmp/./src/sql/session/ob_basic_session_info.cpp:604
oceanbase::observer::ObInnerSQLConnection::switch_tenant(unsigned long) at /home/distcc/tmp/./src/observer/ob_inner_sql_connection.cpp:1813 (discriminator 2)
...
oceanbase::lib::Thread::run() at /home/distcc/tmp/./deps/oblib/src/lib/thread/thread.cpp:162
oceanbase::lib::Thread::__th_start(void*) at /home/distcc/tmp/./deps/oblib/src/lib/thread/thread.cpp:312
?? ??:0
?? ??:0
SQL
You can get some debug information by SQL command. First run the command below to enable the trace:
-- on 4.x
set ob_enable_show_trace=1;
And then run a SQL command, such as:
select * from t, t1 where t.id=t1.id;
After that, you can run the command below to get the trace information:
show trace;
You may got this:
obclient> show trace;
+-------------------------------------------+----------------------------+------------+
| Operation                                 | StartTime                  | ElapseTime |
+-------------------------------------------+----------------------------+------------+
| com_query_process                         | 2023-07-06 15:30:49.907532 | 9.547 ms   |
| └── mpquery_single_stmt                   | 2023-07-06 15:30:49.907552 | 9.506 ms   |
|     ├── sql_compile                       | 2023-07-06 15:30:49.907615 | 6.605 ms   |
|     │   ├── pc_get_plan                   | 2023-07-06 15:30:49.907658 | 0.024 ms   |
|     │   └── hard_parse                    | 2023-07-06 15:30:49.907763 | 6.421 ms   |
|     │       ├── parse                     | 2023-07-06 15:30:49.907773 | 0.119 ms   |
|     │       ├── resolve                   | 2023-07-06 15:30:49.907952 | 0.780 ms   |
|     │       ├── rewrite                   | 2023-07-06 15:30:49.908857 | 1.320 ms   |
|     │       ├── optimize                  | 2023-07-06 15:30:49.910209 | 3.002 ms   |
|     │       ├── code_generate             | 2023-07-06 15:30:49.913243 | 0.459 ms   |
|     │       └── pc_add_plan               | 2023-07-06 15:30:49.914016 | 0.140 ms   |
|     └── sql_execute                       | 2023-07-06 15:30:49.914239 | 2.675 ms   |
|         ├── open                          | 2023-07-06 15:30:49.914246 | 0.217 ms   |
|         ├── response_result               | 2023-07-06 15:30:49.914496 | 1.956 ms   |
|         │   └── do_local_das_task         | 2023-07-06 15:30:49.914584 | 0.862 ms   |
|         └── close                         | 2023-07-06 15:30:49.916474 | 0.415 ms   |
|             ├── close_das_task            | 2023-07-06 15:30:49.916486 | 0.037 ms   |
|             └── end_transaction           | 2023-07-06 15:30:49.916796 | 0.064 ms   |
+-------------------------------------------+----------------------------+------------+
18 rows in set (0.01 sec)
Debug Sync
If you use gdb to debug OceanBase, it maybe cannot work normally because gdb will hang the process and OceanBase depends on the heartbeat to work normally. So we provide a debug sync mechanism to solve this problem.
The specific thread of OceanBase process will hang on the point if you add a debug sync point in the code, and then you can do something to debug the process, such as attach the process by gdb, or execute some SQL commands to get some information.
Debug Sync can work on release mode, so it is enabled on production environment.
How to use
Add a debug sync definition in the code
You can open the file ob_debug_sync_point.h and append your debug sync definition in the macro OB_DEBUG_SYNC_POINT_DEF. For example:
#define OB_DEBUG_SYNC_POINT_DEF(ACT)                               \
    ACT(INVALID_DEBUG_SYNC_POINT, = 0)                             \
    ACT(NOW,)                                                      \
    ACT(MAJOR_FREEZE_BEFORE_SYS_COORDINATE_COMMIT,)                \
    ACT(BEFORE_REBALANCE_TASK_EXECUTE,)                            \
    ACT(REBALANCE_TASK_MGR_BEFORE_EXECUTE_OVER,)                   \
    ACT(UNIT_BALANCE_BEFORE_PARTITION_BALANCE,)
Add a debug sync point in the code
If you want debug some functions, then add your debug sync point there. For example:
int ObRootService::do_restart()
{
  int ret = OB_SUCCESS;

  const int64_t tenant_id = OB_SYS_TENANT_ID;
  SpinWLockGuard rs_list_guard(broadcast_rs_list_lock_);
  ...
  DEBUG_SYNC(BEFORE_UNIT_MANAGER_LOAD);
  ...
}
You can put the same debug sync point anywhere you want.
Enable Debug Sync
Debug sync is disabled by default, you can enable it by the SQL command below:
alter system set debug_sync_timeout='100000s';
The debug sync will be enabled if debug_sync_timeout larger than 0.
NOTE: the unit of
debug_sync_timeoutis microsecond.
Enable your debug sync point
You can enable your debug sync point by the SQL command below:
set ob_global_debug_sync = 'BEFORE_UNIT_MANAGER_LOAD wait_for signal_name execute 10000';
execute means the debug sync action will be disabled after 10000 execution.
signal_name is the name to wakeup.
The specific thread will hang on the debug sync point when it executes the debug sync point and then you can do something to debug the process.
Signal the debug sync point
You can signal the debug sync point by the SQL command below:
set ob_global_debug_sync = 'now signal signal_name';
-- or
set ob_global_debug_sync = 'now broadcast signal_name';
signal_name is the name you set when you enable the debug sync point.
And then the specific thread will continue to execute.
Clear your debug sync point
You should clear your debug sync point after you debug the process, you can clear it by the SQL command below:
set ob_global_debug_sync = 'BEFORE_UNIT_MANAGER_LOAD clear';
Disable debug sync
You can disable debug sync by the SQL command below:
alter system set debug_sync_timeout=0;
How debug sync works
The process will use condition_variable to wait for the signal when it executes the debug sync point, and then it will hang on the debug sync point. The process will continue to execute after it receives the signal.
If you want to know more about the debug sync mechanism, you can refer to the code in ob_debug_sync.cpp/.h.