Develop ob-operator locally
Introduction
ob-operator depends on kubebuilder, an operator framework maintained by kubernetes SIGS. It offers convenient utilities to bootstrap an operator and manage API types in it. Like other operator frameworks, kubebuilder depends on kubernetes controller runtime either, which is an excellent reference to know how kubernetes dispatch events and reconcile resources.
Requirements
- Go 1.22 or above is required to build ob-operator, you can refer to the official website to setup go environment.
- make is used for a variety of build and test actions.
- kubebuilder is used as k8s operator framework. it's highly recommended to read kubebuilder books.
- Access to a kubernetes cluster is required to develop and test the operator. You can use minikube, kind or k3s to create a local kubernetes cluster.
Modify and Apply CRDs
Modify definition of CRDs
ob-operator uses kubebuilder as operator framework, which generates CRDs in YAML format from Go code lies in api/v1alpha1 directory. If you have modified the Go code, for example adding a new field to OBClusterSpec in api/v1alpha1/obcluster_types.go, you need to regenerate the CRDs by running make generate manifests fmt. Then you will see changes in config/crd/bases/oceanbase.oceanbase.com_xxx.yaml files.
Apply the Changes
You can apply the changes of CRDs to kubernetes cluster by running make install. This command will apply the CRDs to the kubernetes cluster.
You will see output like the following after executing kubectl get crds command if the CRDs are successfully applied:
$ kubectl get crds | grep oceanbase.oceanbase.com
obclusters.oceanbase.oceanbase.com               2024-01-01T00:00:00Z
obparameters.oceanbase.oceanbase.com             2024-01-01T00:00:00Z
obresourcerescues.oceanbase.oceanbase.com        2024-01-01T00:00:00Z
observers.oceanbase.oceanbase.com                2024-01-01T00:00:00Z
obtenantbackuppolicies.oceanbase.oceanbase.com   2024-01-01T00:00:00Z
obtenantbackups.oceanbase.oceanbase.com          2024-01-01T00:00:00Z
obtenantoperations.oceanbase.oceanbase.com       2024-01-01T00:00:00Z
obclusteroperations.oceanbase.oceanbase.com      2024-01-01T00:00:00Z
obtenantrestores.oceanbase.oceanbase.com         2024-01-01T00:00:00Z
obtenants.oceanbase.oceanbase.com                2024-01-01T00:00:00Z
obzones.oceanbase.oceanbase.com                  2024-01-01T00:00:00Z
Modify and Run ob-operator
ob-operator acts as a controller manager, which watches the resources in kubernetes cluster and reconciles them. The controller manager is generated by kubebuilder, and the main logic lies in internal/{controller,resource} and pkg/coordinator directories.
Build and Deploy
After modifying the code, you can build the docker image by running make docker-build docker-push IMG=<your-image-name>. Then you can deploy the controller manager to the kubernetes cluster by running make deploy IMG=<your-image-name>.
If the docker need root permission to build, you can run building command with sudo, like
sudo make docker-build IMG=<your-image-name>
make docker-push IMG=<your-image-name> # If you need to push the image to a registry
make deploy IMG=<your-image-name>
If the developing machine and the deploying machine is the same one, you can skip the pushing step make docker-push.
Run locally
Building docker image and pushing it to a registry is time-consuming, especially when you are developing and debugging. You can run controller manager locally to accelerate the development process.
In this step, we'll disable webhook validation and run controller manager on the developing machine. The controller manager will communicate with kubernetes cluster by local .kube/config configuration file.
Disable Webhook and CertManager
There are many configuration items that marked by [CERTMANAGER] and [WEBHOOK] in the two files config/crd/kustomization.yaml and config/default/kustomization.yaml. They are used to enable and configure webhooks in real kubernetes deployment. Because we want to run controller manager locally, we need to disable them.
You could just apply the latest deploy/operator.yaml manifest and delete the following resources to deploy CRDs and make controller manager uninstalled.
kubectl delete validatingwebhookconfigurations.admissionregistration.k8s.io oceanbase-validating-webhook-configuration
kubectl delete mutatingwebhookconfigurations.admissionregistration.k8s.io oceanbase-mutating-webhook-configuration
kubectl delete -n oceanbase-system svc oceanbase-webhook-service
kubectl delete -n oceanbase-system deployments.apps oceanbase-controller-manager
Generate Self-signed Certificates
It's necessary for node hosting controller manager to have a TLS certificate. In the real kubernetes cluster, the cert-manager will inject the sign into the controller manager pod. On our laptop, we need self-sign one:
mkdir -p /tmp/k8s-webhook-server/serving-certs
openssl genrsa -out /tmp/k8s-webhook-server/serving-certs/tls.key 2048
openssl req -new -key /tmp/k8s-webhook-server/serving-certs/tls.key -out /tmp/k8s-webhook-server/serving-certs/tls.csr
openssl x509 -req -days 365 -in /tmp/k8s-webhook-server/serving-certs/tls.csr -signkey /tmp/k8s-webhook-server/serving-certs/tls.key -out /tmp/k8s-webhook-server/serving-certs/tls.crt
Run ob-operator on Your Machine
There are some useful commands in Makefile and make/*.mk, we could type make run-local to start controller manager locally. Or redirect the output to a log file for better analytic experience,
# print log to stdout
make run-local
# or redirect output to a file
make run-local &> bin/run.log
Debugging
Though print debugging is enough for most cases, there are quite some cases that are not obvious from printed information. We could debug with go debugging tool delve.
install-delve command is declared in make/debug.mk, you can type make install-delve to get it. The help message of it can be glanced,
Delve is a source level debugger for Go programs.

Delve enables you to interact with your program by controlling the execution of the process,
evaluating variables, and providing information of thread / goroutine state, CPU register state and more.

The goal of this tool is to provide a simple yet powerful interface for debugging Go programs.

Pass flags to the program you are debugging using `--`, for example:

`dlv exec ./hello -- server --config conf/config.toml`

Usage:
  dlv [command]

Available Commands:
  attach      Attach to running process and begin debugging.
  completion  Generate the autocompletion script for the specified shell
  connect     Connect to a headless debug server with a terminal client.
  core        Examine a core dump.
  dap         Starts a headless TCP server communicating via Debug Adaptor Protocol (DAP).
  debug       Compile and begin debugging main package in current directory, or the package specified.
  exec        Execute a precompiled binary, and begin a debug session.
  help        Help about any command
  test        Compile test binary and begin debugging program.
  trace       Compile and begin tracing program.
  version     Prints version.

Additional help topics:
  dlv backend    Help about the --backend flag.
  dlv log        Help about logging flags.
  dlv redirect   Help about file redirection.
Start delve Debug Server
Run make run-delve simply to start debugging server.
Debug in Terminal
If you prefer to debug in terminal, with dlv connect 127.0.0.1:2345 command you can connect to the debugging server. After connecting, you enter a REPL environment of delve, available commands are showed below,
(dlv) help
The following commands are available:

Running the program:
    call ------------------------ Resumes process, injecting a function call (EXPERIMENTAL!!!)
    continue (alias: c) --------- Run until breakpoint or program termination.
    next (alias: n) ------------- Step over to next source line.
    rebuild --------------------- Rebuild the target executable and restarts it. It does not work if the executable was not built by delve.
    restart (alias: r) ---------- Restart process.
    step (alias: s) ------------- Single step through program.
    step-instruction (alias: si)  Single step a single cpu instruction.
    stepout (alias: so) --------- Step out of the current function.

Manipulating breakpoints:
    break (alias: b) ------- Sets a breakpoint.
    breakpoints (alias: bp)  Print out info for active breakpoints.
    clear ------------------ Deletes breakpoint.
    clearall --------------- Deletes multiple breakpoints.
    condition (alias: cond)  Set breakpoint condition.
    on --------------------- Executes a command when a breakpoint is hit.
    toggle ----------------- Toggles on or off a breakpoint.
    trace (alias: t) ------- Set tracepoint.
    watch ------------------ Set watchpoint.

Viewing program variables and memory:
    args ----------------- Print function arguments.
    display -------------- Print value of an expression every time the program stops.
    examinemem (alias: x)  Examine raw memory at the given address.
    locals --------------- Print local variables.
    print (alias: p) ----- Evaluate an expression.
    regs ----------------- Print contents of CPU registers.
    set ------------------ Changes the value of a variable.
    vars ----------------- Print package variables.
    whatis --------------- Prints type of an expression.

Listing and switching between threads and goroutines:
    goroutine (alias: gr) -- Shows or changes current goroutine
    goroutines (alias: grs)  List program goroutines.
    thread (alias: tr) ----- Switch to the specified thread.
    threads ---------------- Print out info for every traced thread.

Viewing the call stack and selecting frames:
    deferred --------- Executes command in the context of a deferred call.
    down ------------- Move the current frame down.
    frame ------------ Set the current frame, or execute command on a different frame.
    stack (alias: bt)  Print stack trace.
    up --------------- Move the current frame up.

Other commands:
    config --------------------- Changes configuration parameters.
    disassemble (alias: disass)  Disassembler.
    dump ----------------------- Creates a core dump from the current process state
    edit (alias: ed) ----------- Open where you are in $DELVE_EDITOR or $EDITOR
    exit (alias: quit | q) ----- Exit the debugger.
    funcs ---------------------- Print list of functions.
    help (alias: h) ------------ Prints the help message.
    libraries ------------------ List loaded dynamic libraries
    list (alias: ls | l) ------- Show source code.
    packages ------------------- Print list of packages.
    source --------------------- Executes a file containing a list of delve commands
    sources -------------------- Print list of source files.
    target --------------------- Manages child process debugging.
    transcript ----------------- Appends command output to a file.
    types ---------------------- Print list of types

Type help followed by a command for full documentation.
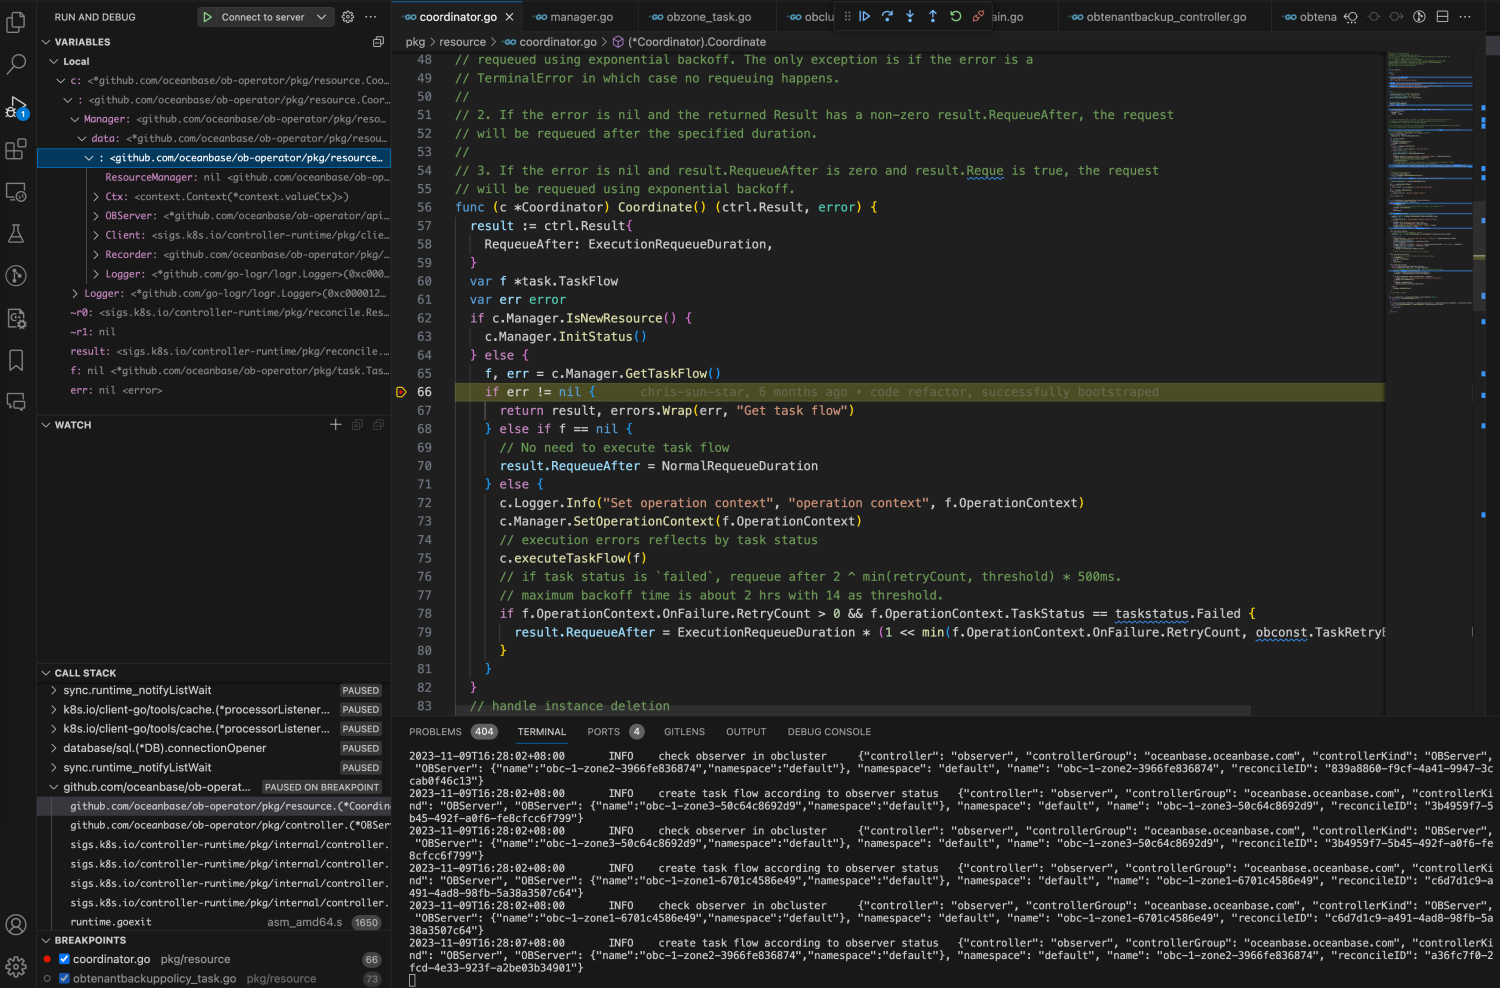
Debug in VSCode
If you are first to debugging in VSCode, enter Cmd+Shift+P to open commands panel. Then, type Debug: Add Configuration... and create debugging task for Go. After creating task successfully, open commands panel and type Debug: Start Debugging/Debug: Select and Start Debugging to start debugging.