OceanBase Dashboard Quick Start
OceanBase Dashboard is a white-screen operation and maintenance tool that is compatible with ob-operator. It has functions such as cluster management, tenant management, backup management, performance monitoring, and terminal connection. It is the preferred tool for monitoring OceanBase cluster performance metrics in a K8s environment.
Deploy OceanBase Dashboard
It's recommended to install OceanBase Dashboard using Helm. After confirming that Helm has been installed, execute the following three commands to install OceanBase Dashboard in the default namespace.
helm repo add ob-operator https://oceanbase.github.io/ob-operator/
helm repo update ob-operator
helm install oceanbase-dashboard ob-operator/oceanbase-dashboard
If you want to install it in another namespace, you can replace the last installation command with the following command (<namespace> is the target namespace you want to install). If the namespace does not exist, you can add --create-namespace to create it.
helm install oceanbase-dashboard ob-operator/oceanbase-dashboard -n <namespace> --create-namespace
If the installation command is executed successfully, the following notes will be displayed.
NAME: oceanbase-dashboard
LAST DEPLOYED: Wed May  8 11:04:49 2024
NAMESPACE: default
STATUS: deployed
REVISION: 1
TEST SUITE: None
NOTES:
Welcome to OceanBase dashboard

1. After installing the dashboard chart, you can use `port-forward` to expose the dashboard outside like:

  > kubectl port-forward -n default services/oceanbase-dashboard-oceanbase-dashboard 18081:80 --address 0.0.0.0

then you can visit the dashboard on http://$YOUR_SERVER_IP:18081

2. Use the following command to get password for default admin user

  > echo $(kubectl get -n default secret oceanbase-dashboard-user-credentials -o jsonpath='{.data.admin}' | base64 -d)

Log in as default account:
Username: admin
Password: <Get from the above command>
It would take some time for the K8s cluster to pull the required images after deployment. You can use the following command to check if OceanBase Dashboard has been installed. If the READY column shows 1/1, the installation is complete.
kubectl get deployment oceanbase-dashboard-oceanbase-dashboard
# Desired output:
NAME                                      READY   UP-TO-DATE   AVAILABLE   AGE
oceanbase-dashboard-oceanbase-dashboard   1/1     1            1           2m10s
Visit OceanBase Dashboard
The default login account created by Dashboard is admin. You can get the default account password by executing the second command in the notes above (echo $(kubectl get ...).
echo $(kubectl get -n default secret oceanbase-dashboard-user-credentials -o jsonpath='{.data.admin}' | base64 -d)
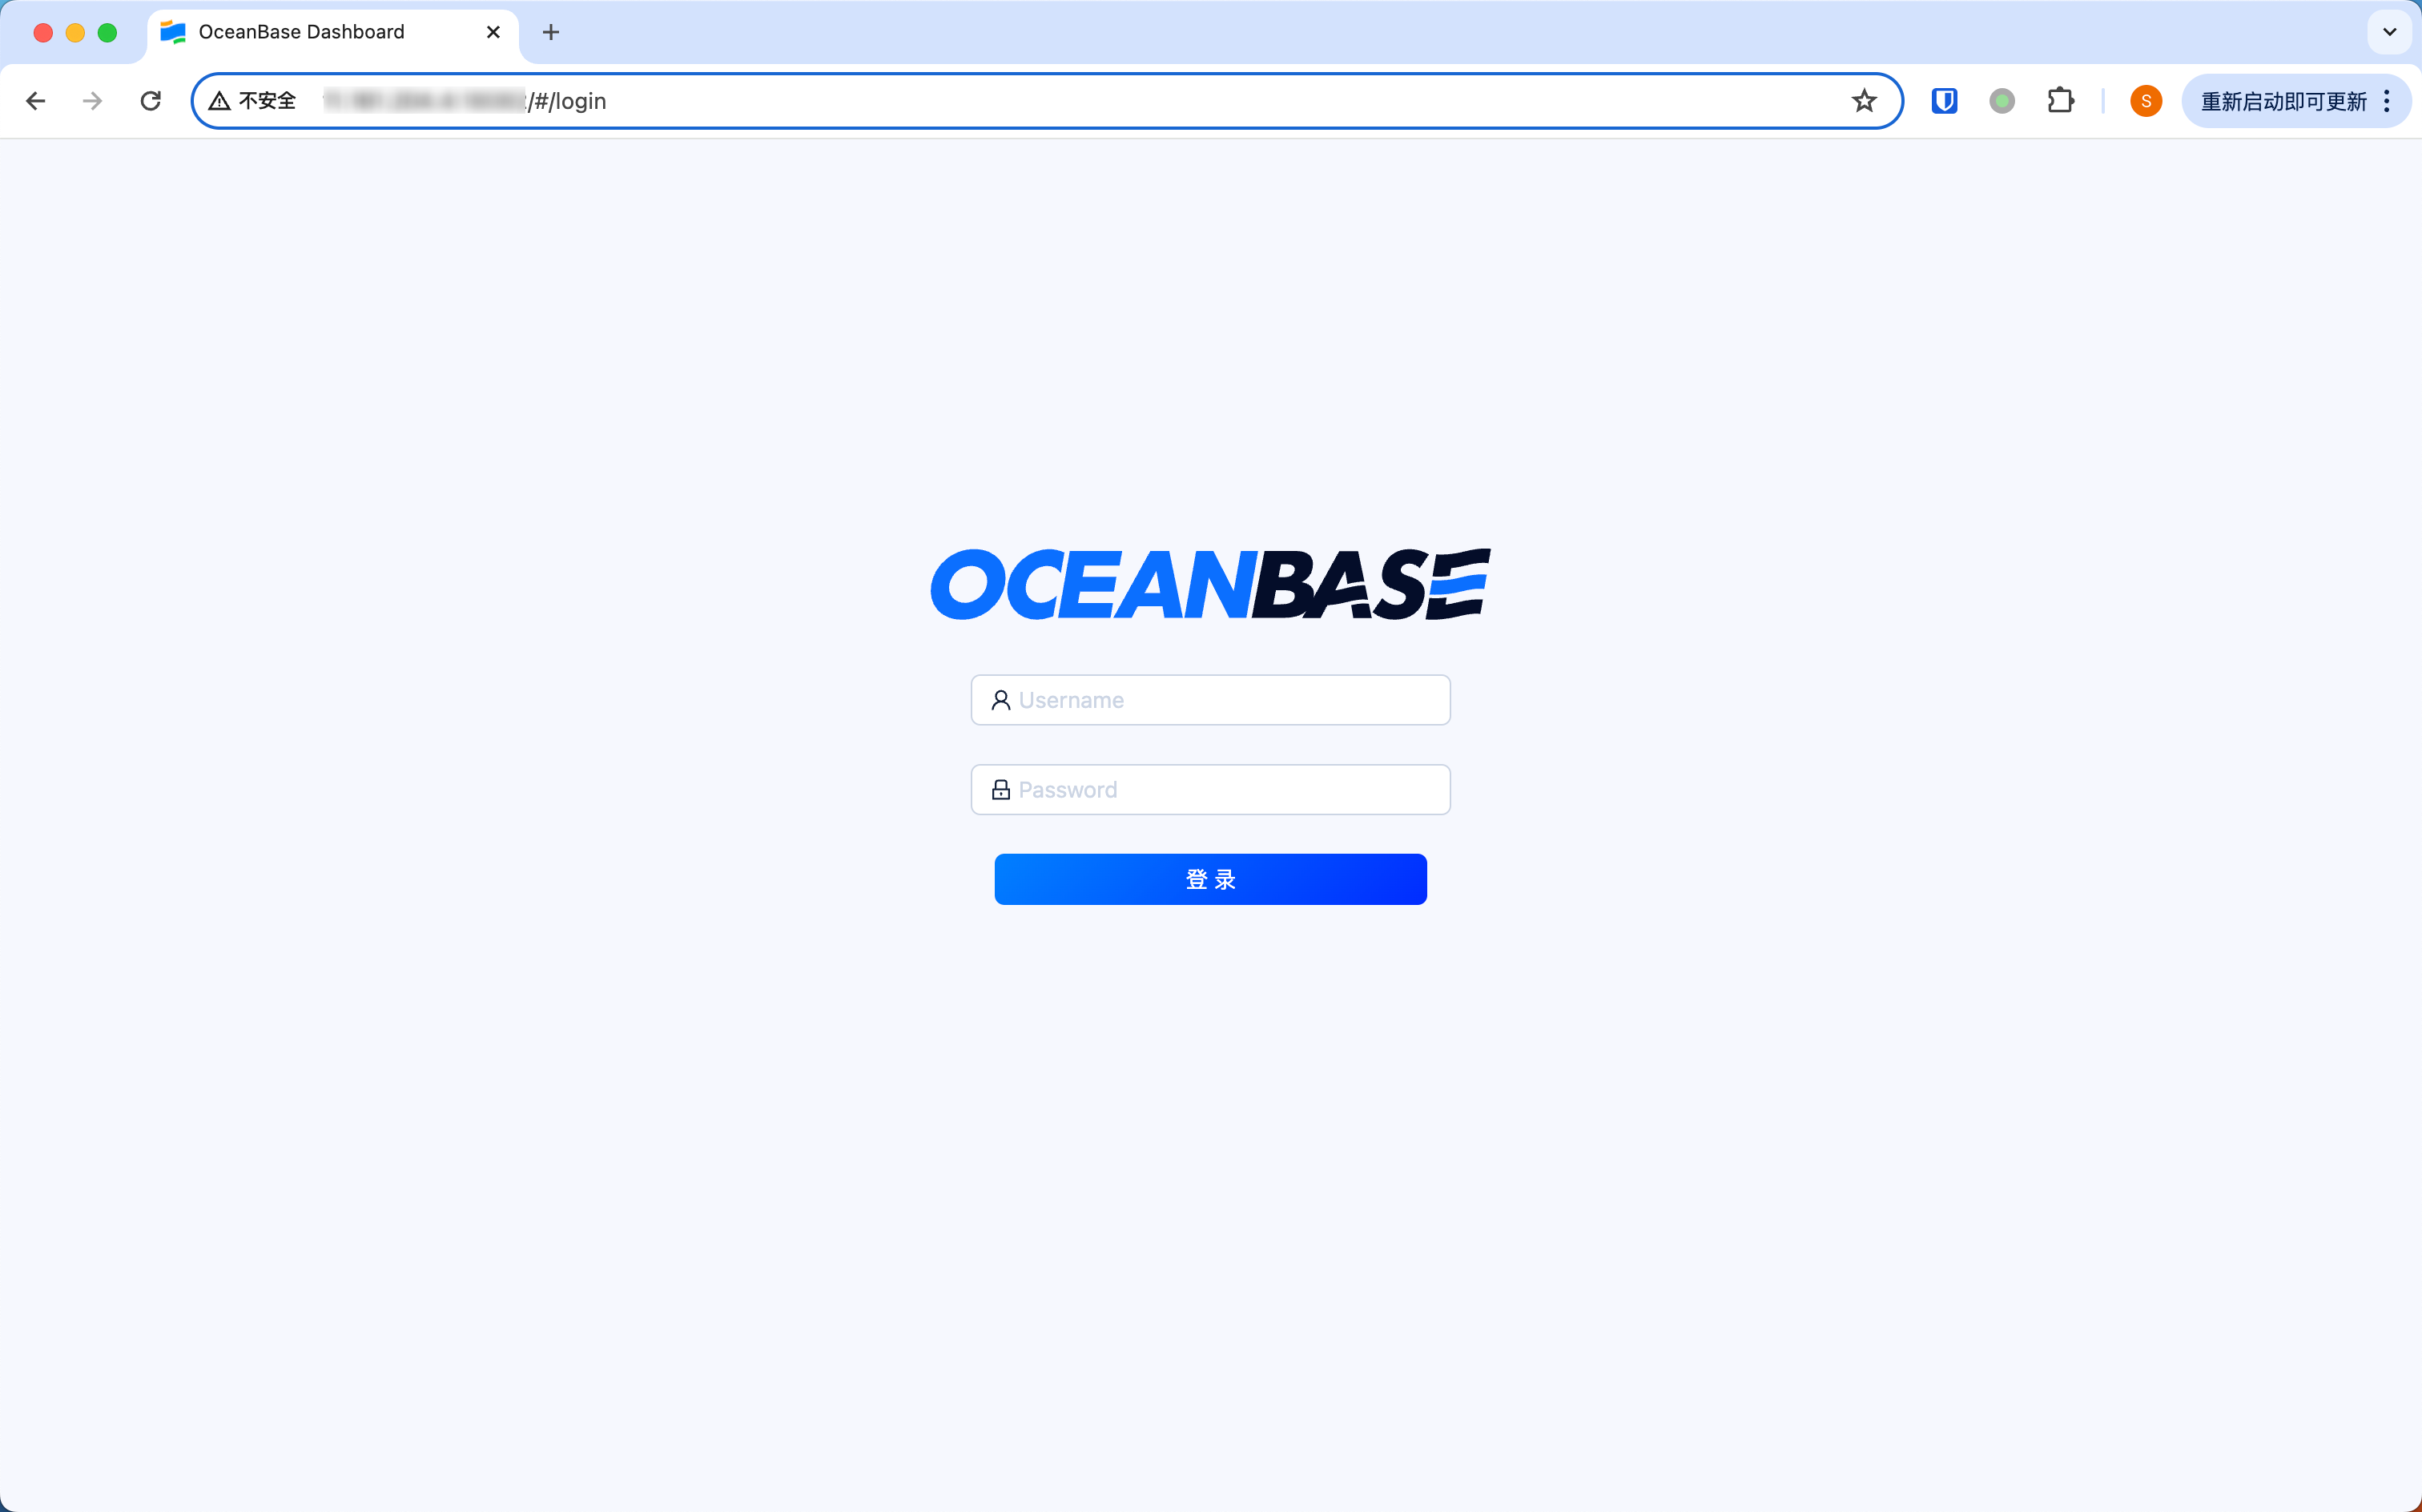
After the installation is complete, you can access the OceanBase Dashboard login page through the following methods.
- By NodePort
- By LoadBalancer
- Temporary Access by Port Forwarding
OceanBase Dashboard creates a Service of type NodePort by default. You can use the following command to get the port exposed on the node by the Service. Please note that the name of the Service will change according to the Helm Chart name you specified, which can be found in the first command in the notes.
kubectl get svc oceanbase-dashboard-oceanbase-dashboard
# Desired output:
Name																			TYPE				CLUSTER-IP			EXTERNAL-IP		PORT(S)					AGE
oceanbase-dashboard-oceanbase-dashboard		NodePort		10.43.20.203		<none>				80:30176/TCP		13m
You can visit the Dashboard login page by accessing the 30176 port of the K8s node in your browser. Please note that the port number of the service is dynamically assigned by Kubernetes, and the port you need to access after installation depends on the actual situation.
If your cluster supports LoadBalancer services, you can specify the service type of OceanBase Dashboard to service during the installation process with the flag: --set service.type=LoadBalancer.
If you have already installed OceanBase Dashboard, you can use the following command to modify the default service type to LoadBalancer. After the modification is successful, the cluster will assign an external IP to the OceanBase Dashboard service, and you can access the OceanBase Dashboard page through this external IP.
kubectl patch svc oceanbase-dashboard-oceanbase-dashboard --type=merge --patch='{"spec": {"type": "LoadBalancer"}}'
The External IP field will be assigned a value after the modification is successful.
$ kubectl get svc
NAME                                      TYPE           CLUSTER-IP      EXTERNAL-IP     PORT(S)        AGE
oceanbase-dashboard-oceanbase-dashboard   LoadBalancer   192.168.xx.xx   xxx.xx.xxx.xx   80:xxxxx/TCP   1d5h
If the node port of your cluster is not accessible so you cannot use the NodePort type service to expose OceanBase Dashboard, and your cluster does not support the LoadBalancer service, you can use the kubectl port-forward command to temporarily expose OceanBase Dashboard to a specified port on the current machine for temporary access. For example, executing the following command will expose OceanBase Dashboard to port 18081 on your current machine (the machine that executes this command).
kubectl port-forward -n default services/oceanbase-dashboard-oceanbase-dashboard 18081:80 --address 0.0.0.0
Visit 18081 port on your machine with a browser to open the login page. Specially, if the port-forward command is executed on your personal computer, you can access the service by opening a browser and visiting http://127.0.0.1:18081.

Check Monitoring Metrics
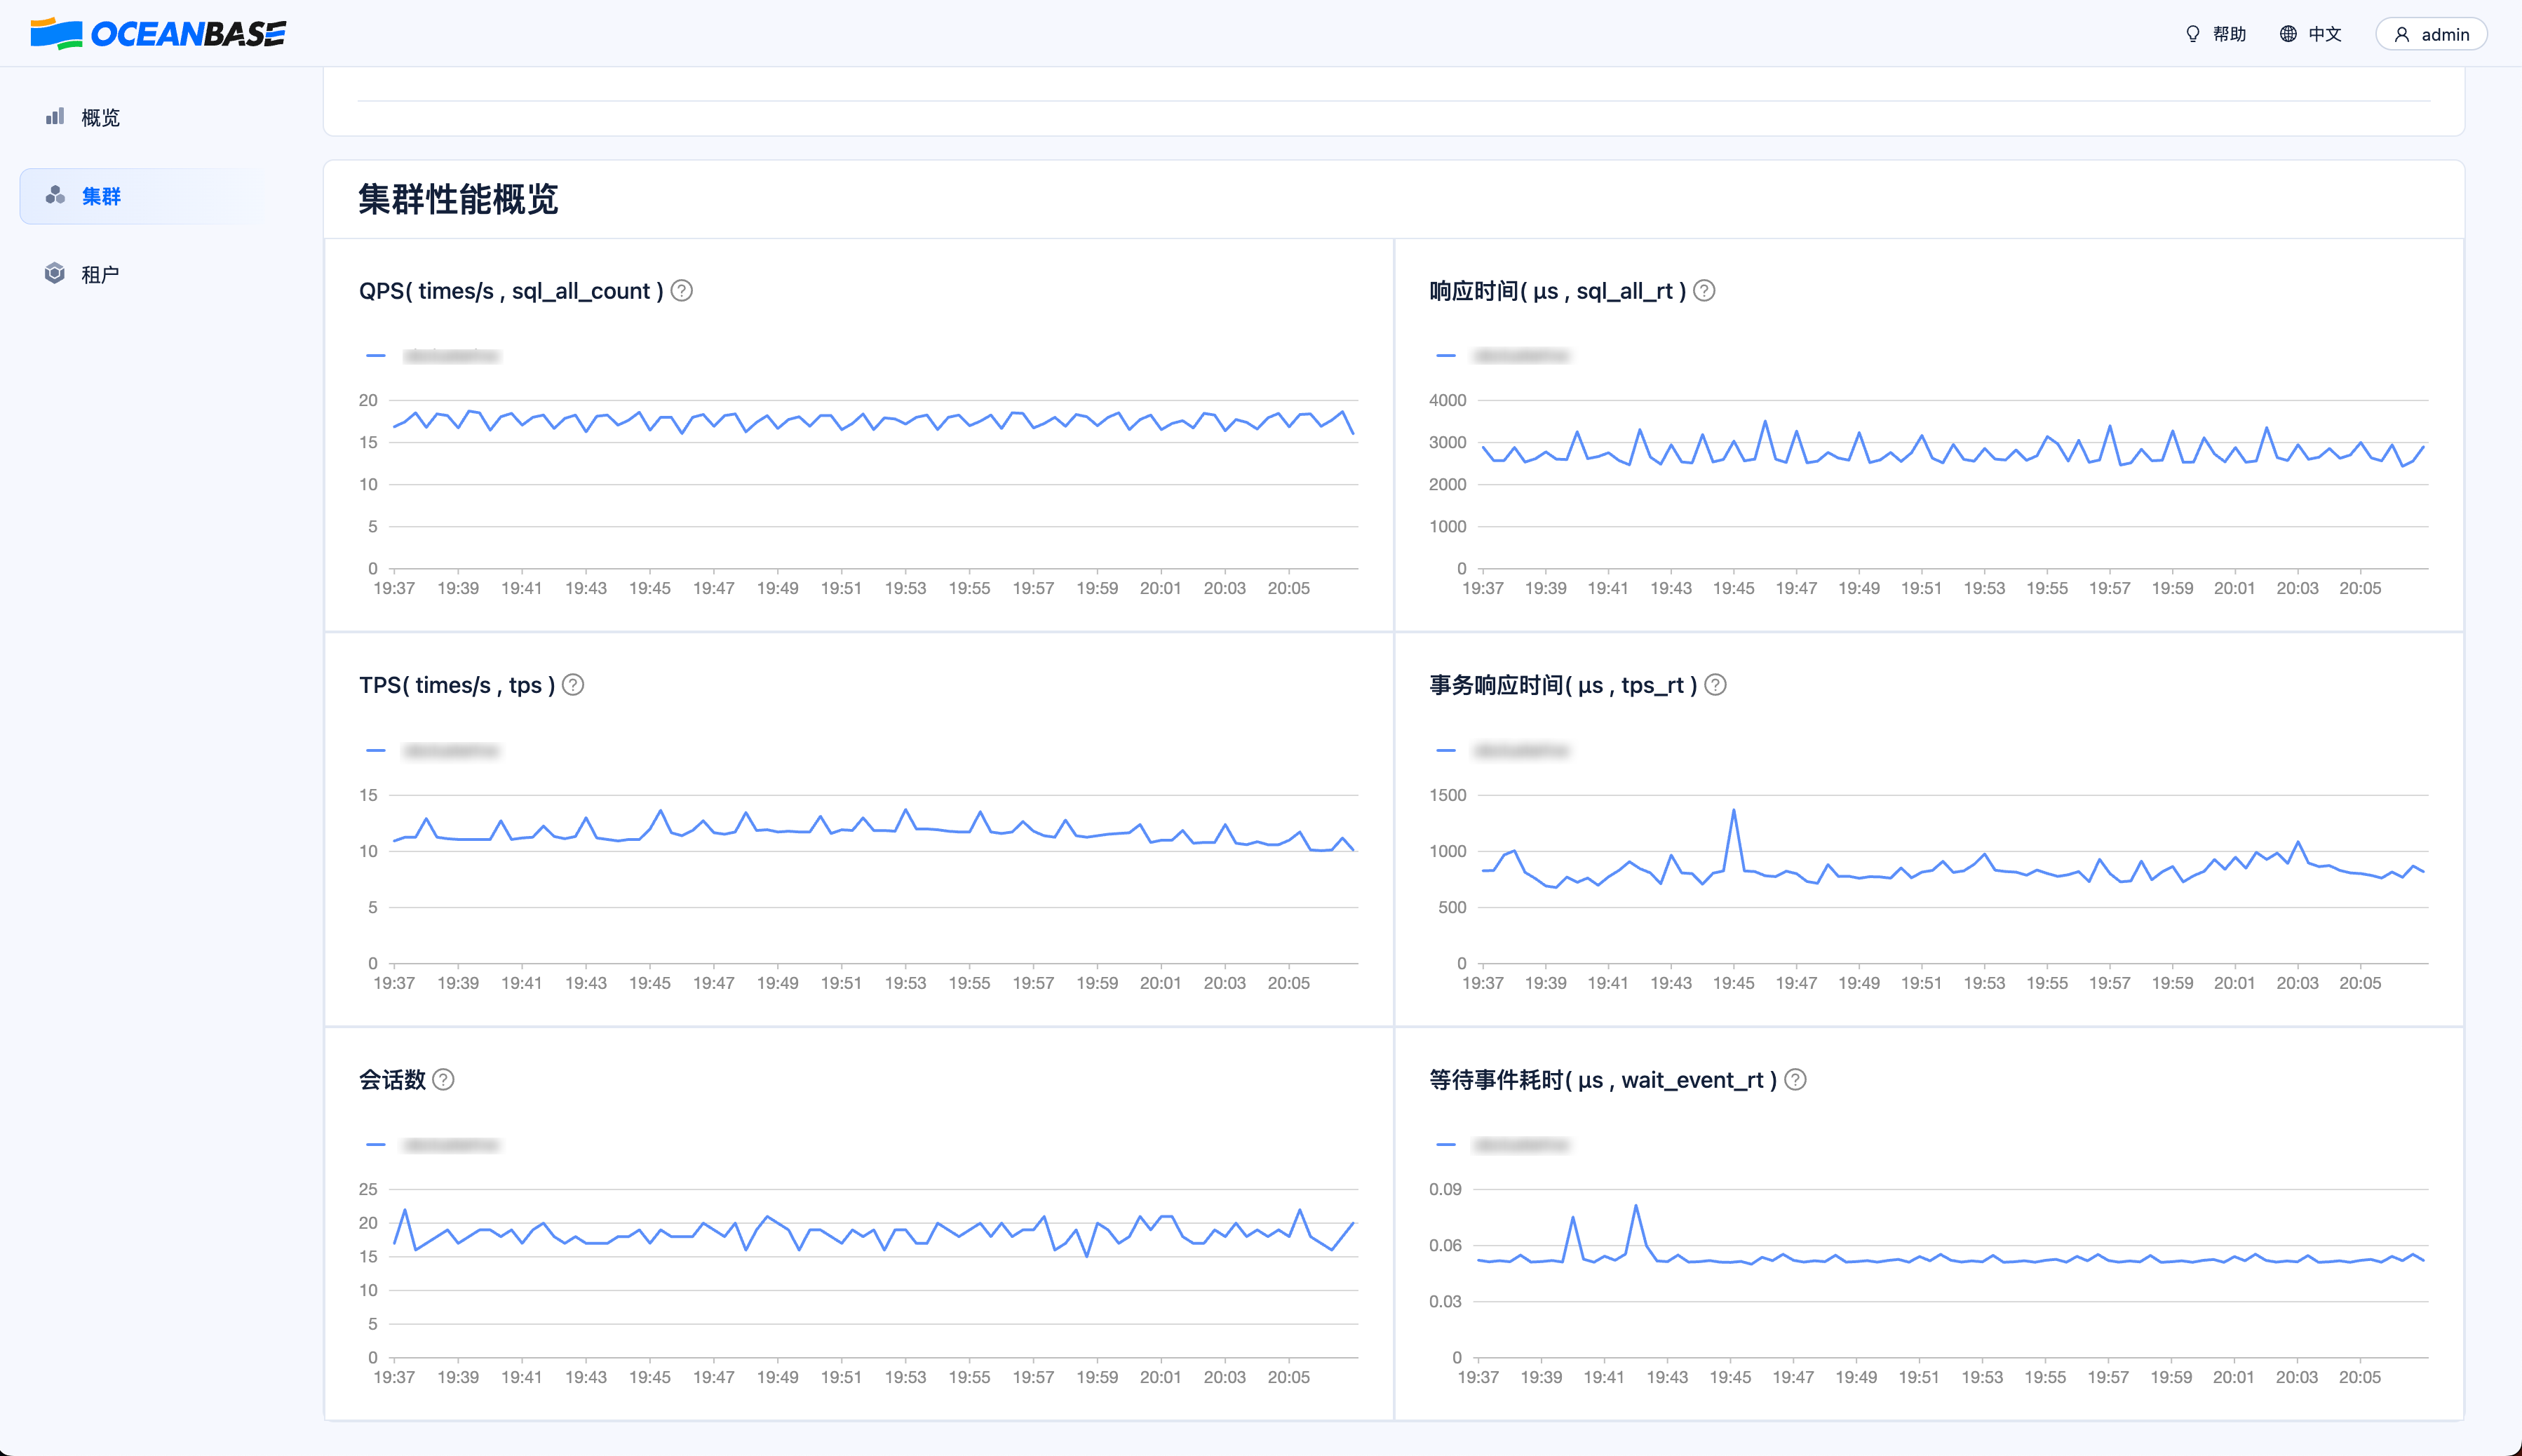
Cluster Monitoring Metrics

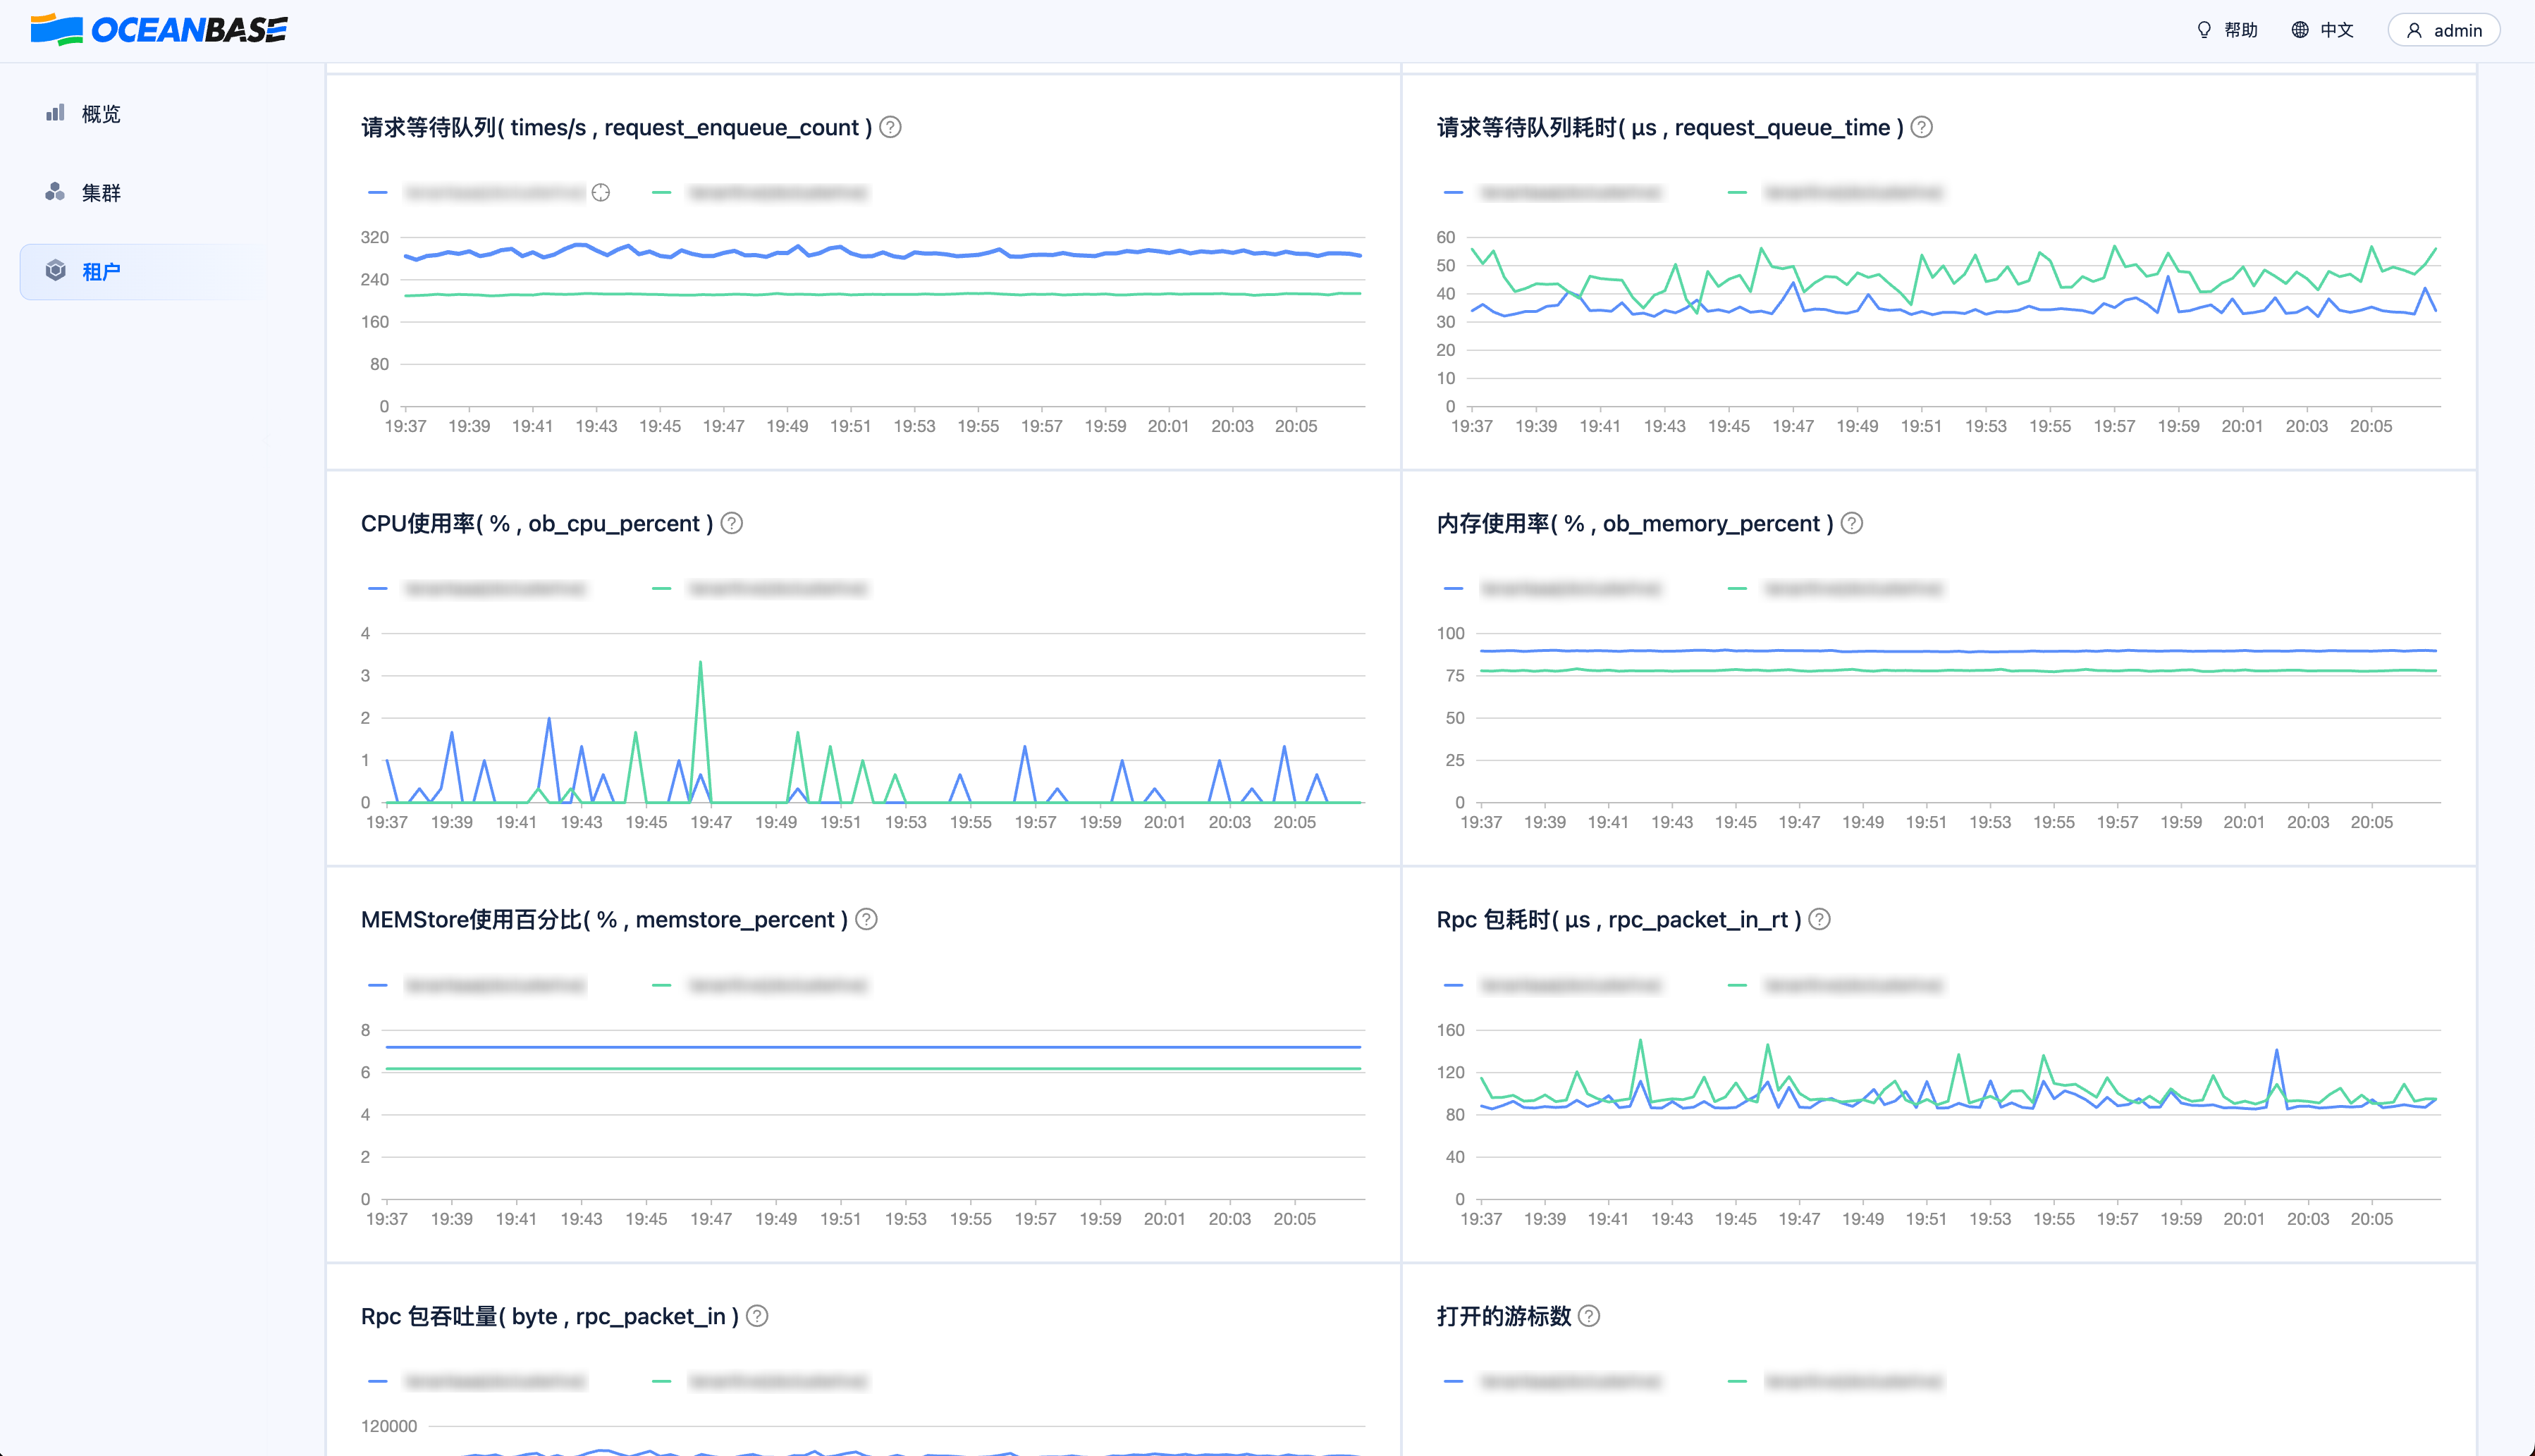
Tenant Monitoring Metrics

Upcoming Features
OBProxy management, monitoring alarms, SQL monitoring, and cluster diagnostics are also under active development and will be released in subsequent versions of the Dashboard.